A candle in a candlestick chart is a figure or price that displays the
low, high, open, and close.
A candle has a body and a wick on the up and down sides of the body,
whereas the body is covered entirely in either red or green with a
wick or a thin, verticle-like small line on the up and down sides of
the body.
A candlestick pattern is a unique kind of pattern that
is displayed in the figure of a candle. It is basically a graphical
image of the price movement of a stock or market.
Candlestick patterns
Below are listed all possible candlestick patterns that one can find
in a candlestick chart with an easy-to-understand image of the
patterns.
The candlestick patterns are:
19. Advance block
Nature: all three candles are bullish or green in color.
Formation: The formation of the advance block candlestick pattern is made up of three candles, which are all green in color or bullish by nature.
The first candle is bullish; the second should open within the body of the first candle and close above the close of the first candle; and the third candle should open within the body of the second candle and close above the close of the second candle.
 |
| Advance block |
Remember that the shadows or wicks of the three candles should be increasing gradually, which means that the wick of the second candle should be bigger than the first candle and the third candle wick should be bigger than the second candle.
It is seen most of the time that the body, at the same time, becomes smaller as it goes.
Functions: Reversal or continuation
If the fourth candle closes below the low of the third candle, then the sentiment of the stock or market becomes bearish and selling prevails, a good sign for reversal.
Continuation happens when the stock keeps on making new highs above the previous candle or keeps on closing above the close.
18. Three inside up
Nature: first red, second green, and third green.
Formation: The three inside up candlestick pattern is a three-candle pattern in which the first candle is a bearish or red candle whose wicks are small.
The second candle opens within the body of the first candle and closes within it, almost above 50% of the first candle, and is a bullish candle and
The third candle is a bullish candle that closes above the high of the first candle.
 |
| Three inside up |
If we sum all the three candles formed, then it will create a hammer-like candle at the end.
Three inside-up candles are basically traded at the area of the support, which confirms the upside trend of the stocks.
Functions: trend reversal in a bullish trend
The first candle has a bearish sentiment, which delivers the continuation of the dominance of the sellers.
The second and third are the candles in which the buyers get active and form a new trend in the stock by reversing the previous trend, as the three inside up candle is a bullish trend reversal.
17. Abandoned baby top
Nature: first is green, second is a doji, and third is red.
Formation: the formation of the abandoned baby top is simple; it is also known as a bearish abandoned baby. It is made up of three candles, and they are:
- The first is a green or bullish candle; it is a big bullish candle.
- The second is a doji, which is an open gap up at the top of the first candle and close above the high of the first candle.
- The third is a red or bearish candle and has an open gap down at the low of the second and closes below the low of the second candle.
 |
| abandoned baby top |
It should be noted that the formation of the abandoned baby top normally happens at the top of the bullish trend.
We may be seeing similarities between the evening star and the abandoned baby top.
The things that differentiate those two are that the abandoned baby top has a doji in the middle, whereas in the evening star, the middle candle or the second candle is not a doji; it is something like a spinning top or small candle.
Functions: trend reversal in a bearish trend
The first candle indicates a continuation of the bullish trend as it is a bullish candle; the second candle displays indecision and thus a doji.
and the third candle marks the start of the bearish trend as it is a bearish candle and sometimes cuts down the low of the first candle.
16. Abandoned baby bottom
Nature: first red, second white as doji, and third green.
Formation: An abandoned baby bottom is also known as a bullish abandoned baby. The formation of the abandoned baby bottom is comprised of three candles, and they are:
First, the candle is a red or bearish-long candle.
Second, the candle is a gap down, usually open below the low of the first candle and close below it. and it is always a doji.
Third, the candle is a long, bullish candle that opens above the high of the second candle and closes above it.
 |
| Abandoned baby bottom |
The abandoned baby bottom, if it happens to occur at the bottom of the bearish trend, would be considered the best one to take a position in.
It should be noted that the abandoned baby bottom and the morning star show some similarity, but the thing that makes them different is the middle or second candle.
In the abandoned baby bottom, the middle candle should be a doji, and in the morning star, it is not always considered a doji; it may or may not be a doji.
Functions: trend reversal in bullish.
As the abandoned baby bottom reverses the bearish trend to a bullish trend, it is considered a bullish trend reversal pattern in the candlestick chart pattern.
The first candle tells us that the seller has continuation effects; the second candle tells us of the undecision occurring in the market; and the third candle indicates that the buyers are back and are ready to move the price upward.
15. Bearish engulfing
Nature: the first candle is bullish, and the second is a bearish candle.
Formation: The formation of the bearish engulfing candlestick pattern is easy to get from the candlestick chart.
The first candle is a bullish candle, and the second candle is a bearish candle, which engulfs the body of the first candle wholly.
Usually, the high, low, close, and open of the second candle are greater than the first candle.
 |
| Bearish engulfing |
Basically, the bearish engulfing candlestick pattern is searched at the top of the bullish trend to get the highest benefit.
Functions: reversal in the bearish trend
The first candle of the bearish engulfing candlestick pattern tells us about the power of the buyers and
The second candle makes a seller have dominance over the buyers and hence starts a new bearish trend as the bullish trend is over after the pattern discloses the power of the sellers.
14. Bearish separating lines
Nature: the first candle is bullish, and the second candle is a bearish candle.
Formation: the making of the bearish separating lines is very simple and forms somewhere in the middle of the bearish trend.
 |
| Bearish separating lines |
The first candle is a bullish candle, and the second candle is a bearish candle, and both of the candles are opening at the same price.
But the second candle is closing below the first candle and marks the continuation of the bearish trend.
Functions: continuation in the bearish trend.
The first candle of bearish separating lines indicates the gains of the buyers, whereas the second candle marks the gains of the sellers over the buyers.
13. Bearish Harami
Nature: the first candle is bullish, and the second is a bearish candle.
Formations: The bearish Harami candlestick pattern is made up of two candles, where the first candle is a bullish and long candle and the second candle is a small and bearish candle.
The only difference between those two candles is that the second candle should be forming between the body of the first candle; its high and low should be contained within the body of the first candle.
 |
| Bearish harami |
It is meant that if the bearish-harami candlestick pattern is forming at the top of the bulish trend, then the downtrend is likely to have more chances of happening.
Functions: reversal in the bearish trend
The first candle reflects the continuation of the strong bullish trend, whereas
The second candle reflects the end of the interests of the buyers and the start of the dominance of the sellers.
12. Evening star
Nature: first bullish, second bullish or bearish, and third bearish
Formations: The evening star candlestick pattern is a three-candle pattern in which the first candle is a bullish candle, which generally denotes the continuation of the bullish trend.
The second candle is a bullish or bearish candle, but the thing to remember here is that it is a gap-up opened candle. and
The third candle is a gap-down candle, which is a big candle in comparison to the second candle and is bearish in nature.
The first and third candles are big, and the second is small; sometimes it is a doji.
The wicks are small, and the bodies of the three candles are big.
|
| Evening star |
Normally, the everning star is found at the top of the bullish trend, which, in turn, causes the price to fall.
Functions: reversal in the bearish trend.
The first denotes the buyer’s dominance over the seller. The second is a gap-up.
The third indicates that the sellers are back, which causes the price to fall quickly.
11. Three black crows
Nature: all three candles are bearish candles.
Formation: The three black crows are a pattern of three candles, and they are:
- first candle, it somewhere opens higher than the previous candle and closes in a red or bearish colour.
- The second candle opens inside the first candle and closes in a red or bearish candle, in which the close of the candle is lower than the previous close.
- The third candle, too, opens inside the second candle and closes below the second candle.
All three candles have a short wick or no wick, and all the candles close below the previous candle.
 |
| Three black crows |
Normally, the candles are big red candles, usually bigger than normal-sized candles.
Functions: reversal in the bearish trend
As the three black crows are searched at the top of the bullish trend, when it is formed, a bearish trend is supposed to happen.
The three black crows give an indication of a bearish trend by forming big red candles, which indicate the strength of sellers over buyers.
10. Bullish engulfing pattern
Formation: The bullish engulfing pattern has one of the simple formation candlestick patterns where not much is seen to be confirmed about its formation.
Only two candles are seen to judge its formation: one is red or bearish, and the second is bullish or green.
The first candle is a red or bearish candle, and the second candle opens a gap down than its previous candle, but sometimes it has been seen that the second candle doesn’t always gap down.
 |
| Bullish engulfing |
But the thing to notice is whether the second candle covers fully the body of the first candle or not, and if the second candle engulfs the first candle, then the formation of the bullish engulfing pattern is confirmed.
Functions: reversal in a bullish trend
The bullish engulfing pattern is made up of two candles, and the two candles say two different things, which are:
- The first red or bearish candle, in this case, sellers, becomes dominant.
- The second green or bullish candle, in this case, the buyer, changes the game, fully engulfs the sellers that were present at the previous candle, and makes a new trend, which is bullish.
9. Morning star pattern
Nature: 1st bearish, 2nd bullish or bearish, and 3rd bullish.
Formations: The morning star pattern candlestick is a three candlestick pattern, in which the first candle is a long bearish candle.
The second candle is an indecisive candle, which can be bullish or bearish, but it is small in size and most likely looks like a spinning top, and
The third candle is a long bullish candle, which is also big in size.
|
| Morning star pattern |
The things to remember here are that the second candle is a gap-down candle, and the third candle is a gap-up candle.
Functions: reversal in a bullish trend.
The morning star pattern finishes the bearish trend and starts a new bullish trend, as it is a bullish reversal pattern.
The three candles describe three different things.
- 1st candle: sellers are heavier than buyers.
- 2nd candle: describes the indecisiveness in the stock; it may be bullish or bearish in nature.
- 3rd candle: buyers are heavier than sellers and make a fresh start to the bullish trend.
8. Kicker Bullish
Nature: one bearish and one bullish
Formation: Bullish kicker has a very simple formation of two candles, one bearish and the other bullish, with a gap-up opening.
The thing to remember is that its value increases if it happens to occur at the bottom of the bearish trend because it reverses to a bullish trend.
 |
| Bullish kicker |
If found in the middle of any trend, then it is uncertain to predict its trend, but normally it is seen that it follows its natural trend if found in the middle.
Functions: Reversal in a bullish trend
As it is a bullish trend reversal pattern, mostly if it occurs at the bottom of a bearish trend, its accuracy increases if it happens with good volume and if it co-incides with the positive signs of indicators like moving average, RSI, Macd, etc.
7. Piercing line pattern
Nature: the first candle is bearish, and the second is bullish.
Formation: The formation of piercing line candlestick pattern consists of two candles: the first one is bearish, and the second is bullish. The second candle opens a gap down and closes above 50% of the bearish candle, or closes just below the open of the bearish candle.
 |
| Piercing line |
Functions: trend reversal
It reverses the bearish trend into a bullish trend.
It is basically searched for more at the bottom of the bearish trend, but if it is found anywhere in the middle of the bullish or bearish trend, then its effectiveness in reversing becomes uncertain.
6. Three white soldiers
Nature: the three candlesticks are green or bullish in color.
Formation: the formation of the three white soldiers candles is very simple; every candle is green in color, denoting the bullishness of the candle.
Basically, there are three candles: the first opens and closes in green with no wick or small wick, the second opens within the first candle and closes above the high of the first candle, and the third too opens within the second candle and closes above the high of the second candle.
 |
| Three white soldiers |
Normally, it is seen that the body has no wick or has a very minute wick. It is better to consider the body that has no wick the best.
Functions: uptrend or continuation (sideways)
It is found at the bottom of the bearish trend, which indicates the reversal of the trend from bearish to bullish.
but if found in the sideways market, then it is likely to have a continuation of the sideways market.
5. Hammer
Nature: It can be a bullish or bearish candle.
Formation: A hammer candle is a candle that has a small body with
a long wick on one side and a small one on the other. Usually, the
longer side wick is almost 2/3 rd in comparison to the small wick.
The body of the hammer candle closes near the opening of the body; if it
has a long wick on the downside, then its small wick will be on the
upside, and vice versa.
Two types of hammers are available on the candlestick chart, and
they are:
- Hammer candlestick: it is usually seen with a long
wick on the downside of the body compared to the upside wick of
the body, which is small. It can be a bearish or bullish
candle. |
| Hammer candlestick |
- Inverted hammer candlestick: same as the hammer
candlestick, the thing that makes it different from the hammer
candle is its wick. The long wick of the inverted hammer candle is
on the upside of the body. It is very similar to the real-life
hammer, put in an inverted position. |
| Inverted hammer |
Functions: It is a strong reversal candlestick pattern.
The hammer candlestick pattern is mostly seen in the downtrend of the
market.
This is a strong indication of the reversal of the bearish trend into
a bullish trend.
4. Marubozu
Nature: It is usually a strong bullish or bearish candle.
Formation: It is a body-only candle with no wick on the down and up
sides, and the body too is filled with a full green or full red color,
indicating the strong bullishness and strong bearishness of the stock or
of the price of the stock.
Marubozu has two types, and they are:
- Bearish Marubozu, which has only a red-filled body with no wick on either side.
 |
| Bearish Marubozu |
- Bullish Marubozu, which has only a green-filled body with a wick on either
side.
 |
| Bullish Marubozu |
Functions: reversal or continuation of the trend.
Reversal happens when the Marubozu happens at the bottom with
the bullish candle and at the top with the bearish candle.
Continuation happens when the Marubozu happens in the middle of
any trend, whether at the bullish trend with the bullish candle or at
the bearish trend with the bearish candle.
3. Tweezer tops and bottoms
Nature: It can be a bearish or bullish candle, or one bearish and
another bullish, or one bullish and another bearish, as it is formed in two
consecutive candles.
Formation: There are two types of tweezer candles we normally see,
and they are:
- Tweezer tops:
formed at the top of the bullish trend, with at least two candles with the
same tops.
 |
| Tweezer Top |
- Tweezer bottoms: formed at the bottom of the bearish trend,
with the two candles having the same bottoms.
 |
| Tweezer Bottom |
Functions: Reversal (changing the present trend to the
opposite trend)
- If a tweezer top is made, then it has a chance of a bearish market as
it is made at the top of the bullish trend. - If tweezer bottom is made, then it has a chance of a bullish market
as it is made at the bottom of a bearish trend.
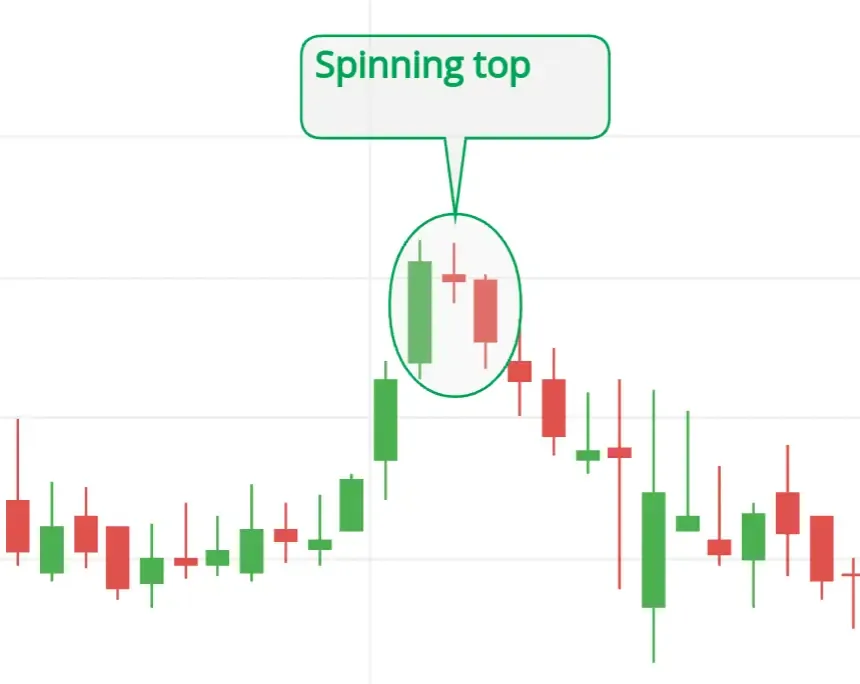
2. Spinning top
Nature:
can be a bullish or bearish candle
Formation: A spinning top is a candle in which the wicks of the upside
and downside are equal in length, or almost equal, with a small body in the
center.
 |
| Spinning top candlestick |
Functions:
sideways or reversal.
If a spinning top is made, there are possible chances of a sideways market, or
it could change the present trend to another trend, for example, from bearish
to bullish or from bullish to bearish (reversal).
1. Doji
Nature:
can be bullish or bearish, depending on the previous price.
Formation: there is no color in the candle as the open and close are
the same and no body is formed, just a dash of horizontal shape.
There are wicks on the lower and higher sides of the body. There are normally
four types of doji seen in the candlestick chart, and they
are:
- Long-legged doji: wick on the low and high sides of the candle
with a dash in the middle of the candle.
 |
| Doji or long-legged doji |
- Gravestone doji: only a wick on the upside, no wick on the
downside, just a dash on the downside. - dragonfly doji: same as gravestone doji, but the only difference
is that it has wick on the downside and not on the upside; on the upside,
it has only a dash. - price doji: single dash, not anything else.
 |
| Gravestone doji, dragonfly doji, price doji |
Functions:
sideways or reversal
Doji’s main function is to change the present trend to the opposite trend.
For example, it reverses the trend from bullish to bearish or from bullish
to bearish.
Final thoughts
All the possible candlestick patterns that exist on the candlestick chart have been discussed here.
Candlestick patterns are a great way to make a profit, as if the candlestick patterns are identified, then it can make a great trade with a fast profit.
The candlestick pattern does not always work, as there are no things that work always, but when the candlestick pattern works, it creates a profitable trade.
Trade with presence of mind; use the candlestick pattern with the money management strategy to lower the risk of a wrong trade.
Remember: We do not confirm the trueness of the 100% accuracy of the candlestick pattern here in this post or article, but as far as possible, we have tried our best to provide you with the correct information about the candlestick pattern.