Trends are the most important factor to be considered while
trading.
trading.
In this post, we will be discussing five of the top indicators for identifying
trends.
trends.
Before we use the trend factor in our trading, let us know about the
meaning of the trend in the trading premises.
meaning of the trend in the trading premises.
Trend is nothing but the direction of the stocks related to price movement;
for example, if the direction of the stock is upside, then we will consider it
an upside trend, and when it goes downside, then it will be a
downside trend.
for example, if the direction of the stock is upside, then we will consider it
an upside trend, and when it goes downside, then it will be a
downside trend.
If the stock is in an upside trend, then its price increases, and if it is in
a downside trend, then its price decreases.
a downside trend, then its price decreases.
as the downside trend indicates seller dominance and the upside trend
indicates buyer dominance.
indicates buyer dominance.
Why is identification of the trend important?
Because any indicator, strategy, or anything in trading will work only if we
are going to use it on the trend-related side; otherwise, everything will be
futile, and we will be sadly amazed by the result.
are going to use it on the trend-related side; otherwise, everything will be
futile, and we will be sadly amazed by the result.
There is a very famous line that says, “Trend is a friend.”. and it is highly
recommended by every trader that one should trade with the trend instead of
going against it.
recommended by every trader that one should trade with the trend instead of
going against it.
Trend identifier indicators
Here are the top 5 trend identifier indicators.
5. AROON
The Aroon indicator was made by Tushar Chande, who is an
Indian. Very few people from India are involved in making indicators.
Indian. Very few people from India are involved in making indicators.
The Aroon indicator is not that famous. But it is really effective in the
sense of providing the new highs and lows or giving us an idea of the
highs and lows of the stock price.
sense of providing the new highs and lows or giving us an idea of the
highs and lows of the stock price.
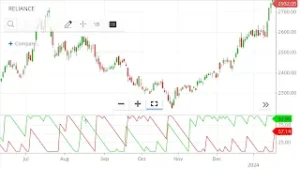
The Aroon indicator has two lines. One is red and the other is green, but
it may differ depending on the platform on which one is trading.
it may differ depending on the platform on which one is trading.
The default period is 14 days, but if we want, we can change it to our
desired default period, say 25 days, which can give us an idea of one
month.
desired default period, say 25 days, which can give us an idea of one
month.
How do I trade using the Aroon indicator?
There are two lines in the aroon indicator; one is the green line, which
basically denotes the aroon up line and is bullish in nature.
basically denotes the aroon up line and is bullish in nature.
 |
| Aroon indicator |
The other is the red line, which denotes the aroon down, which is bearish
in nature.
in nature.
When to buy and how to get to know about the tops or highs?
When the aroon up line is crossing from down the aroon down line and at
the same time the aroon up is above the level of 50, then there is a
positive sign for going long, and we should be buying the stocks.
the same time the aroon up is above the level of 50, then there is a
positive sign for going long, and we should be buying the stocks.
When the Aroon line touches the level of 100, it is to be assumed that the
new high is made in the stock price within the default period of 14 days,
or whatever default period we have set.
new high is made in the stock price within the default period of 14 days,
or whatever default period we have set.
When to sell and how to get to know about the bottoms or lows?
If the Aroon up is crossing the aroon down from above and at the same time
the aroon up is going below the level of 50, then it is assumed to be a
bearish sign, and selling can be initiated.
the aroon up is going below the level of 50, then it is assumed to be a
bearish sign, and selling can be initiated.
In other words, if the Aroon down is crossing the aroon up line from the
down and is above level 50, then the selling is to be commended.
down and is above level 50, then the selling is to be commended.
New lows and bottoms are found when the aroon down is touching the figure
zero or close to zero. The default period should be kept in mind.
zero or close to zero. The default period should be kept in mind.
Remember when the aroon up and
aroon down are both close to one another and are not crossing but going
together? Then it should be meant as a sideways market in which buying and
selling should not be done.
aroon down are both close to one another and are not crossing but going
together? Then it should be meant as a sideways market in which buying and
selling should not be done.
4. ADX/DMI
First of all, let us be aware of the full form of
ADX and DMI, which stand for average directional index and directional
moving indicator.
ADX and DMI, which stand for average directional index and directional
moving indicator.
As we know, it is a trend strength-measuring indicator that tells us about
the trend and its strength.
the trend and its strength.
Basically, its most common usage is intraday trading because the intraday
trend factor is most important as the movement in the stocks is volatile and
fast.
trend factor is most important as the movement in the stocks is volatile and
fast.
The two most important things we get from ADX/DMI are:
- trend strength and
- buy and sell signals.
How do I trade with ADX/DMI?
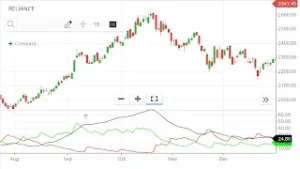
First of all, we will be seeing the three lines in this indicator, which are
the ADX line, +DI line (positive directional indicator), and -DI line.
(negative directional indicators).
the ADX line, +DI line (positive directional indicator), and -DI line.
(negative directional indicators).
The best situation for buying is when the ADX line is above 25 and the +DI
crosses over the -DI.
crosses over the -DI.
 |
| ADX DMI buying signal |
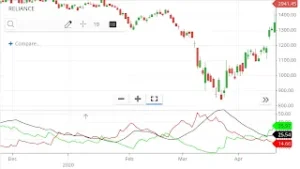
And for selling, the ideal situation will be when the ADX is below 25 and
the -DI crosses over the +DI.
the -DI crosses over the +DI.
 |
| ADX DMI selling signal |
Basically, the ADX line is a blue or black color line, +Di is a green color
line denoting the positiveness, and -DI is a red color line denoting the
negativeness.
line denoting the positiveness, and -DI is a red color line denoting the
negativeness.
and whereas about the stoploss, the trade should be exited when the ADX line
is below the 25.
is below the 25.
Strategy to be used in ADX/DMI?
The best strategy to be used with the
moving average crossover. For a simple moving average, the period of 20 and 50 days, or as per your
comfort, whichever is best for the stock,.
moving average crossover. For a simple moving average, the period of 20 and 50 days, or as per your
comfort, whichever is best for the stock,.
If the trade is done when the ADX line is above 25 and simultaneously the
crossover or crossbelow happens in the moving average line of the stock,
then it could be the best opportunity to buy and sell the stocks with
stoploss or exit to be when the crossbelow or crossover happens.
crossover or crossbelow happens in the moving average line of the stock,
then it could be the best opportunity to buy and sell the stocks with
stoploss or exit to be when the crossbelow or crossover happens.
3. Supertrend
A supertrend indicator is a trend-analyzing indicator that
smooths our search for the trend in the stock.
smooths our search for the trend in the stock.
Basically, the supertrend indicator uses the multiplier and the ATR to find
its value; ATR stands for average true range, and it calculates the
market or stock volatility, whereas the multiplier is a constant value that
is affected by the market or stock to become sensitive to the price
movement.
its value; ATR stands for average true range, and it calculates the
market or stock volatility, whereas the multiplier is a constant value that
is affected by the market or stock to become sensitive to the price
movement.
Why should we use the supertrend indicator?
There are many reasons to choose the supertrend indicator, and some of them
are:
are:
- It gives an idea of the
support and resistance
of the present stock. - Stoploss can easily be predicted with the target to take.
- It is not that much affected by the volatility as there is an ATR
value involved. Most of the indicators are volatility-sensitive, but
the supertrend indicator is not. - As it is a trend identifier indicator, the trend can easily be
identified. - Breakouts and breakdowns can be easily predicted by the suptrend
indicator, which can provide us with a good result in our trading
strategy and the idea of the price movement in the stock.
How do I trade in a supertrend indicator?
The trading in the supertrend indicator gets simpler because of its easy and
friendly look at the candlestick chart.
friendly look at the candlestick chart.
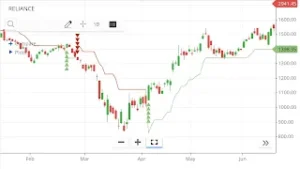
There are two lines in the supertrend indicator: one is a green line, and
the other is a red line.
the other is a red line.
 |
| Supertrend |
If the stock price is above the green line, then buying can be initiated, as
it indicates a bullish signal. And
it indicates a bullish signal. And
When the red line is above the price of the stock, the selling is done, as
it indicates a bearish signal.
it indicates a bearish signal.
Stoploss
- In a buying situation, the stoploss should be below the green line
and - In a selling situation, the stoploss should be above the red
line.
2. Donchian Channel
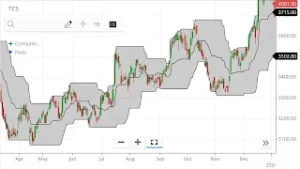
The Donchian channel is one of the best trend-analysing
indicators.
indicators.
The Donchian channel is basically used for knowing
about the highs and lows of the given default period set in the
indicator.
about the highs and lows of the given default period set in the
indicator.
For example, if the set period in the indicator is 20, then it tells
us about the highs and lows of the previous 20 days.
us about the highs and lows of the previous 20 days.
There are three lines in the Donchian channel: one is the upper band,
which is on top; one is the lower band, which is at the bottom; and
the other is in the middle, which tells the average of the two lines,
which are the upper band and the lower band.
which is on top; one is the lower band, which is at the bottom; and
the other is in the middle, which tells the average of the two lines,
which are the upper band and the lower band.
How do I trade in the Donchian channel?
First of all, we should understand that this is a trend-idea-giving
indicator on which we can know about the present trend in the stock
price and trade according to it.
indicator on which we can know about the present trend in the stock
price and trade according to it.
There are mainly three things in the Donchian Channel to trade, and
they are:
they are:
1. Support and resistance trading
When we see that the channels are widening, it is recommended that
support and resistance in Donchian channel trading be avoided.
support and resistance in Donchian channel trading be avoided.
But if it is narrow, normally it will then be in a sideways market,
and
support and resistance could be working best, and trading can then commence.
and
support and resistance could be working best, and trading can then commence.
2. Breakout and breakdown trading
As breakout and breakdown are the best ways of trading and results
are basically on the traders side, in a Donchian channel too, we can
do breakdown and breakout trading.
are basically on the traders side, in a Donchian channel too, we can
do breakdown and breakout trading.
Breakout trading in the Donchian channel is done when the stock price
breaks out above the high of the channel. And
breaks out above the high of the channel. And
Breakdown trading is done when the stock price breaks down below the
low of the Donchian channel.
low of the Donchian channel.
3. trading the upside band and downside band
In this trading, the price hit is on the high end of the Donchian
channel; basically, trading is done on the price hit continuously on
the upper band of the Donchian channel.
channel; basically, trading is done on the price hit continuously on
the upper band of the Donchian channel.
And the downside trading is done with the price hitting the lower
band continuously.
band continuously.
In this trading, the trades are done with the flow of the trend shown
in the Donchian channel.
in the Donchian channel.
Stoploss
- The stoploss is simple: if we are going long or bullish, then
the stoploss should be below the lower band. And - If we are going short or bearish, then stoploss should be above
the upper band.
Strategy
It is best to trade with the Donchian channel with some other
indicators like MACD, RSI, and mostly with the moving average.
indicators like MACD, RSI, and mostly with the moving average.
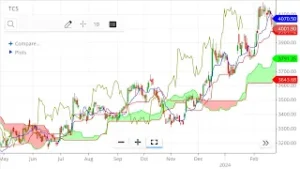
1. Ichimoku cloud
The Ichimoku cloud in itself is all. Everything one needs in
a chart to see a trend and a trading signal is given at ease in the
Ichimoku cloud.
a chart to see a trend and a trading signal is given at ease in the
Ichimoku cloud.
At first, it looks a little complicated, but once you learn it, it becomes
easy to use.
easy to use.
What all do we see in the Ichimoku cloud?
Things that are in the Ichimoku cloud and that should be known before
using it are:
using it are:
- Lagging span, which is displayed in the past of the chart of the
default period of 26 days. - Leading spans A and B, which are displayed in the future of the chart.
Both calculations are different and are displayed in the form of
colored clouds; one is green and the other is red.Calculations
are differently taken out for the leading spans a and b. Leading span
A is taken out by conversion line + base line / 2. and is displayed in
green color.And whereas the leading span B is taken out by
adding the 52 minus period high and 52 minus period low / 2. And is
seen in red.Remember that the leading spans A and B are
plotted in the future of the stocks by 26 periods. - The conversion line is colored blue, and the base line is colored red.
How do I trade in the Ichimoku cloud?
First of all, if you want to trade with
support and resistance in the Ichimoku cloud, then it could be done
if the cloud is thick or fat, and if the cloud is thin, then there is a
high possibility of a breakout or breakdown in the stock.
support and resistance in the Ichimoku cloud, then it could be done
if the cloud is thick or fat, and if the cloud is thin, then there is a
high possibility of a breakout or breakdown in the stock.
If someone is looking to trade the crossover, then it could be done when
the conversion line crosses the base from below or above.
the conversion line crosses the base from below or above.
 |
| ichimoku cloud |
If the conversion line crosses below the base line, then selling should be
done, and if the conversion line crosses above the base line, then buying
is to be done.
done, and if the conversion line crosses above the base line, then buying
is to be done.
Basically, the trend is accepted as the direction of the conversion line
changes.
changes.
whereas about the stoploss, if going long, then the previous
low should be the stoploss, and if going short, then the previous high
is the stoploss.
low should be the stoploss, and if going short, then the previous high
is the stoploss.
Final thoughts
Basically, all the indicators are made to give the traders a hint of
the present situation of the stocks or market, and on the basis of
that, we use our composure to trade for the future result.
the present situation of the stocks or market, and on the basis of
that, we use our composure to trade for the future result.
But wait, not every time we make a profit; sometimes it will happen
that our prediction may be wrong, and at that time we should be
sticking to our stoploss and should come out of the trade on our
strict stoploss level.
that our prediction may be wrong, and at that time we should be
sticking to our stoploss and should come out of the trade on our
strict stoploss level.
The above-mentioned are the best 5 indicators to find the correct
trend information, and if we are trading using them, then they will
definitely give the best profit percentage. We just need to trade with
these indicators with stoploss and money management.
trend information, and if we are trading using them, then they will
definitely give the best profit percentage. We just need to trade with
these indicators with stoploss and money management.
FAQs
Frequently Asked Questions on Trend Indicators
- What is the trend in trading?
- Trend means the direction or flow of the market; if it is
in the up direction, then it is called an upside trend, and
vice versa, a downside trend.
- Trend means the direction or flow of the market; if it is
- Is the trend enough for trading?
- Yes, trend alone is enough, but we should be cautious of the
instant changes happening in the market, and on the basis of
that, we should be coming out of it as fast as we can.
- Yes, trend alone is enough, but we should be cautious of the
- What is the trend in trading?

