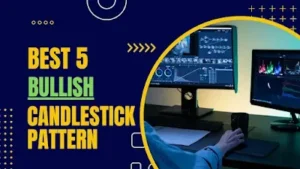
Are you finding the best 5 candlestick patterns to boost your trading?
You came to the right place. Read the whole article to learn about it.
Candlestick patterns are the best way to read the candlestick chart.

As we can easily understand by seeing the candlestick pattern, when to buy and
sell depends on the trade and the candlestick formation.
The best 5 candlestick patterns are:
5. spinning top
The spinning top is the candlestick pattern, which looks like a spinner.
As we already know about the low, high, open, and close of a candlestick,.
A candlestick has a wick. A wick is nothing but the thin line that points out
below and above the body of the candlestick.
 |
| Spinning top candlestick |
In a spinning top, a candle has an equal length of wick below and above the body of the
candlestick, with the small body in the middle. It can be green or red in
color, depending on the sentiment of the stock.
There are two types of spinning tops that are normally seen, and they
are:
- single candle spinning top and
- double candle spinning top
What does the spinning top candlestick pattern tell us?
A spinning-top candlestick pattern is made when there is great confusion
between buyers and sellers.
As buyers pull the stock price high, forming a wick upside, and consequently,
sellers pull it low, forming a wick downside, both wicks are of equal length.
Possible Directions:
- sideways are possibly seen.
- If it happens in a downtrend or an uptrend, a reversal is seen.
4. Doji
could be related to a spinning top candlestick or something else of a
similar kind.
 |
| Doji or long-legged doji |
a doji.
in a candlestick chart.
- Lond-legged doji: represents a long head and long tail wick with no body in the
middle, just a dash. - Gravestone doji: It has no legs but a long head. It usually occurs in a bearish
trend with a bull in the market; just try to take the price above,
creating a long head, but fail to take and come to position where it
opens. - Dragonfly doji: It has no head but a long tail. It usually happens in an uptrend
where the price opens high and the bear of the market takes it down
but fails to sustain it, creating a long tail and going back to its
position from where it started.
 |
| Gravestone doji, dragonfly doji, price doji |
- Price-doji, single-line doji, or horizontal doji: it is basically a dash (horizontal line dash) that may happen in
the downtrend or in the uptrend. It forms due to an upper or lower
circuit.
What does the Doji candlestick pattern tell us?
the bulls and bears are not able to take the stock up or down and the
price remains constant, making the opening and closing prices the
same.
- sideways or working in a range
- trend reversal, as doji is seen as probably changing the direction of
the stock price.
3. Tweezer candlestick pattern
the same bottom or top candles.
shape, length, and colour, but the tops and bottoms are the
same.
are:
- Tweezer Tops and
- Tweezer bottoms
trend in the stock or in the market, and the two candles are formed
with the same tops.
 |
| Tweezer Top |
bearish trend in the stock or market and the candles are formed,
displaying the same bottoms.
 |
| Tweezer Bottom |
What does the Tweezer candlestick pattern tell us?
tops and bottoms of the stocks, not allowing the stock to go above the
top or below the bottom.
- Reversal (changing from the present direction to the opposite
direction).
- If it appears at the top, then the stock is likely going to go
down. and - If it appears at the bottom, then it is preparing the stock to go
above.
2. Marubozu
which is mostly used by newbies because it is easier to find than
any other candlestick pattern in the chart.
down sides.
sentiment in the stock or in the market, as it fills the whole
body with low, high, close, and open.
Marubozu candlestick patterns, and they are:
- Bearish Marubozu: this is a candlestick body
that has no wick but only a body with a red color, denoting
the strong bearishness of the price or the stock.
Bearish Marubozu - Bullish Marubozu: in this candlestick, the
candle has only a body with no wick on the downside or upside.
It is green in color, denoting the strong bullishness of the
price or the stock.
- Bearish Marubozu: this is a candlestick body

 |
| Bullish Marubozu |
What does the Marubozu candlestick pattern tell us?
people, whether bears or bulls.
rule, then bullish or green candles happen.
as close in a bullish Marubozu candle and high as open and close
as low in a bearish Marubozu candle.
- Continuation of trend: If the bearish or bullish Marubozu candles happen in the
middle of the bearish or bullish trend, then it is taken as a
continuation of the present trend. - Reversal of the trend: it means changing the present trend to an opposing trend,
and in Marubozu, there are two cases where the reversal is
meant to happen, and they are:1.
Reversal to the bearish trend
when the bearish candle happens in the bullish trend, usually
at the top.2.
Reversal to the bullish trend when the bullish candle
happens in the bearish trend, usually at the bottom.
1. Hammer
patterns, which is not only used by newbies but also by
experts.
is very low compared to any other candlestick pattern.
What is a hammer candlestick pattern? What does it look
like?
chart that looks like a hammer.
a wick, whereas the body closes below or above the opening of
the candle with a long wick either on the upside or downside,
with the small wick on the other side.
they are:
- Hammer candle: it has a small body with a long wick on the downside,
almost 2/3rd of the upside wick of the candle.
Hammer candlestick - Inverted hammer candle: it is just the opposite of the hammer candle; the only
difference is that it has a long wick on the upside.
Inverted hammer


the downtrend of the market or in a bearish market. Most
people mistake the shooting star candlestick pattern for an
inverted hammer candlestick pattern.
What does the Hammer candlestick pattern tell us?
there is a bearish sentiment going on in the stock or in the
market.
close it near the opening of the candle, reflecting a good
accumulation by the buyers over the sellers. It gives a
positive sign for buying the stock, and the confirmation is
gotten when the next candle after the hammer closes above
it.
- Strong Reversal
pattern that strongly reverses the bearish trend to a
bullish trend.
Final thoughts
easy to understand, which provides me with the best opportunity to
take a trade in any segment or stock.
only thing you need to do is use a stoploss and accept if the
candlestick does not provide you with the result that you thought
it would.
provide. So why wait? Go learn it and use it.
FAQs on the 5 best candlestick patterns
- What is the difference between a hammer and an inverted hammer?
- A hammer has a long wick on the downside and a small one on the top
of the body, whereas an inverted hammer has a long wick on the top
side of the body and a small one on the bottom side.
- A hammer has a long wick on the downside and a small one on the top
- What is the difference between a hammer and an inverted hammer?
- Does Marubozu have any wicks?
- No, Marubozu has no wick on the up and down sides of the
body.
- No, Marubozu has no wick on the up and down sides of the
- Does Marubozu have any wicks?