Many traders are very confused about the top-most indicators, which they
should know about. Actually, when they go trading, they see different types of
indicators, and when they fail to get profit from them, they skip that
indicator and go to another one in search of a better one.
After a lot of trading and looking at the chart of the person who trades
regularly and makes a decent profit out of that, we have come to know about
the five most used and famous indicators, which should be known to the traders
who are new to trading and very serious about trading. lets start.
The top 5 indicators for short-term or intraday trading are:
5. RSI
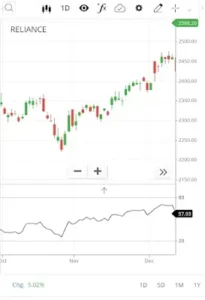
The relative strength index is a technical momentum-measuring indicator. It
measures the momentum of the stock by making us find the overbought and
oversold parts of the stock.
Basically, if the RSI of the stock shows us that if the stock is below 20,
then we assume it is oversold, and if it shows above 80, then we assume it is
overbought.
There is another way in which RSI is being traded, and that is divergence.
Divergence is nothing but the opposite of the RSI related to the figure of the
stock; if the stock is showing something and the RSI is not matching the
figure of the stock, then divergence happens.
For example, if the stock is showing a lower low but the RSI is showing a
higher low, then divergence is meant to happen, and vice versa.
Trendlines are also used in the RSI indicators to further detain the trend of
the RSI for more detailed trading.
 |
| RSI |
What all things are seen in RSI for buying and selling of the stock to do
trading?
- Overbought and Oversold
- Divergence
- Some traders use trendlines in the RSI to take a trade.
4. MACD
the new indicators.
- Better exploration of the available indicators.
- They might not be getting a very accurate result from this.
trend-identifying indicator wholly based on the EMA (exponential moving
average).
- histogram
- zero line and
- EMA (exponential moving average).
apply the MACD indicator, and you are done.
 |
| MACD |
How to use:
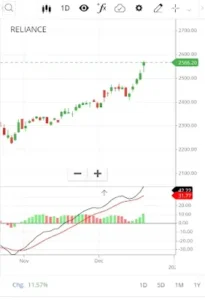
- crossover – Mark this word in your mind: MACD, MACD singal
line, zero line.Now, when the MACD in the MACD indicator
crosses above the MACD signal line, traders assume that to be a bullish
trend, and when it goes below, they take it as bearish. Normally, MACD
is shown in blue, and the MACD signal line is shown in red. - Divergence – As discussed earlier in the RSI, the same as in
the MACD, just the opposite happening in the stock in relation to the
MACD indicator is meant to cause divergence.For example, if
the stock is making low and lower-low but the indicator is showing
lower-low and higher-low, there is divergence.
been discussed in brief.
3. Stochastic Indicator
taught stochastic indicators first, as it is very important for the newbie
to develop the logic of share ups and downs in our minds.
even the specialists use it to identify stock behaviour.
identify the momentum of the stock. If you compare the RSI and stochastic,
then you will find that both are almost the same as both functions are
identified with one another.
 |
| STOCHASTIC |
How to use:
RSI, but still there are differences. Let us describe below the ways in
which stochastics can be used for trading. Follow the ways.
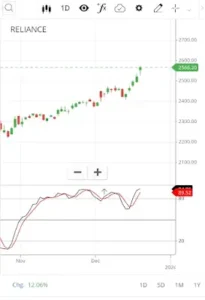
- Overbought and oversold – It is said to be overbought when
the stochastic is above 80%, and if it is below the 20% mark, then it is
said to be oversold, and buying and selling of the stock is judged on
these bases: above 80%, the seller becomes active, and below 20%, the
buyer becomes active. - Crossover – When the slow stochastic crosses the fast
stochastic line, selling starts, and when the fast stochastic crosses
the slow stochastic, buying starts.Basically, it is the norm
that follows in stochastics, and it changes according to certain news
and other activities of the market. - Divergence – Well, I think this need not be explained
anymore because earlier in this post we discussed the RSI and MACD
indicators of divergence.To know more about the divergence,
go to the RSI and MACD indicators for further details. - Own Formula – Many people and big names use this tool in
their own way; they have their own way of using it. For example, they
stretch the trendline and make a horizontal line on the stochastic to
further judge the stocks in their own way.
2. VWAP
now a trend, and people are so anxious about trading because no one
wants to wait even a second; they need their return fast and in profit,
so this indicator is very useful and is now used too much by the
traders.
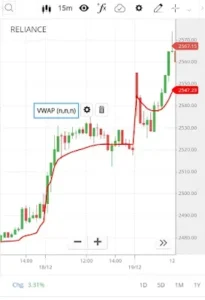
now the most famous and important indicator these days, and rarely does
any trader not go for it.
understand from the name itself, it has something to do with the volume
of the stock. One of the most distinguishing features of this indicator
that makes it different from any other indicator is that it is a
single-line and single-day indicator.
means it refreshes itself at every new session of trading, or you can
take it as an intraday indicator.
 |
| VWAP |
How to use:
- A single line indication – as we have already discussed
above, it is a single line indicator, so buying is done when the
stock is above that line and selling when the stock is below that
line. - support and resistance – It is not used much in this,
but there are a few traders who do it. If you find it comfortable
for you, then you can go for it; otherwise, it is not used much as
its results are uneven.Support is when the stock is
resting above the line of the stock, and resistance is when the
stock is resting below the line of the stock, and trades are taken
on the basis that it will go down after touching the resistance and
support.
1. Bollinger Band
indicator is a boon to traders and investors. Not only does it have
a high chance of profitability, but it also has a simple look, which
makes learning the candlestick chart easier.
indicator, as it tells everything you need to know about the
condition of the stock.
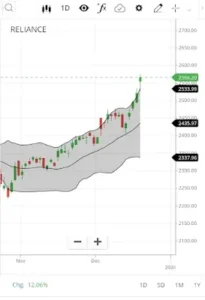
this indicator, you will find three lines, and these lines indicate
the lower band, the moving average line, and the upper band.
the stocks. Basically, the Bollinger Band helps determine whether
the stock price is high or low. If it is high, then the Bollinger
Band upper band would be touching, and if it is low, its lower band
would be touching the stock price. If it is in the middle of the
price, then it could happen that it would be touching or staying in
the middle line, which is the moving average line.
 |
| BOLLINGER-BAND |
How to use:
- Overbought and Oversold – Follow these two cases to
know how to take trades on this basis.
Case 1: If it is overbought, then the Bollinger Band upper line is
touching the stock price, and we go for shorting or selling the
stock.
Case 2: If it is oversold, then the
Bollinger Band lower band is touching the stock price, and we go
for long or buy the stock. - Moving Average Lookout – Well, there are many traders and
investors who look for moving average trading in the Bollinger
Band. Essentially, they determine their trading on the basis of
the stock price, whether it is above or below the moving average
line. If above, they go for buying, and if below, they go for
selling.
Final words
vary in listing to different traders, as there are traders who
may be using different indicators of their choice of
sophastication.
choice by the traders, and they really make a profitable trade
if they are used perfectly. So why are you waiting? Go and use
it now to become profitable.
FAQs
- [question 1]
- What are the five indicators described above?
- RSI, MACD, STOCHASTIC, VWAP, and BOLLINGER BAND
- What are the five indicators described above?
- [question 2]
- How is this ranking of positions done?
- See, this is based solely on our research and survey,
which we have done by asking people who have traded in
stocks with more than 10 years of experience.
- See, this is based solely on our research and survey,
- How is this ranking of positions done?
- [question 3]
- Do these indicators work only in trading?
- No, these work fine for both trading and investing
purposes.
- No, these work fine for both trading and investing
- Do these indicators work only in trading?

