Support and resistance are two very important things that everyone should
know.
know.
Normally, every trader uses the supoort and resistance to take and exit their
trades.
trades.
Support and resistance are not as easy as people think; it is
not only the line that we stretch; it is more than that.
not only the line that we stretch; it is more than that.
The psychology behind support and resistance is very deep, and in this
article, we will try to cover everything that relates to the fundamental and
technical aspects of support and resistance.
article, we will try to cover everything that relates to the fundamental and
technical aspects of support and resistance.
What is support? Why should we use it?
Support is something in the market that displays the resting
position, or the position or point where the stock price will come to rest.
position, or the position or point where the stock price will come to rest.
whereas we should be using it to determine the stock price’s resting position.
For example, if the stock price is falling and we want to know the price at
which the price will stop, then we should take the example of the previous
support to determine it.
For example, if the stock price is falling and we want to know the price at
which the price will stop, then we should take the example of the previous
support to determine it.
Support can be of different types, but mainly three types are used to
determine it:
determine it:
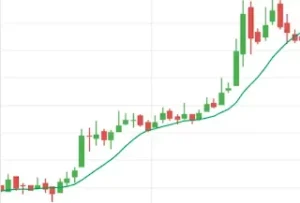
- Moving average support: the price will be supported on the line of
the moving average from the upside.
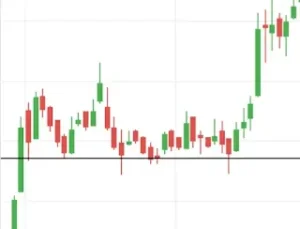
Moving average support - horizontal line support: the price will take support at that price
level where previously our price has taken rest as an assumption of future
support.
Horizontal line support - Trendline support: the price takes support from the upside of the
trendline.
- Moving average support: the price will be supported on the line of
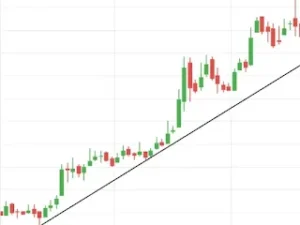 |
| Trendline support |
It is to be noted that support is always given to the price, which is falling.
From the three discussed above, horizontal line support is the most used and
valid support line, which is acknowledged as the best.
valid support line, which is acknowledged as the best.
Support lines are mostly used for taking advantage of buying stocks because it
is expected that the price will move upside from that support line in the
future trading session.
is expected that the price will move upside from that support line in the
future trading session.
As the support gives the buyers a great opportunity to buy the stock, so does
the horizontal line, which gives us the best way to determine the support
level of any stock.
the horizontal line, which gives us the best way to determine the support
level of any stock.
What is resistance? Why should we use it?
A thing that resists is resistance. But in trading,
resistance is a level by which touching the price of the stock
gets down or a level where the price cannot pass through.
resistance is a level by which touching the price of the stock
gets down or a level where the price cannot pass through.
For example, if the price is 100 and the resistance level is 140, then the
price will get down by touching the figure 140, or the price cannot go above
the figure 140.
price will get down by touching the figure 140, or the price cannot go above
the figure 140.
Whereas we are using the resistance level to determine the price, we can
exit our present position of the stock or we can think of selling the stock
because to sell the stock at the resistance level, our stoploss becomes less
and target increases.
exit our present position of the stock or we can think of selling the stock
because to sell the stock at the resistance level, our stoploss becomes less
and target increases.
As we talked about the support above, the resistance too has three types of
uses that are normally used by traders to determine the resistance level, or
doing which we can get the resistance level.
uses that are normally used by traders to determine the resistance level, or
doing which we can get the resistance level.
The three types are:
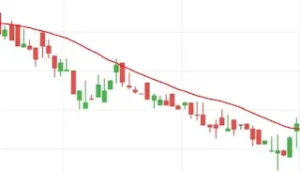
- Moving average resistance: the price gets touched from the downside of the moving average line,
and the line is not letting the price move upside of the moving average
as a result, creating a strong resistance.
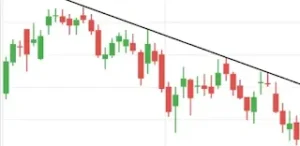
Moving average resistance line - Trendline resistance: It is a line that is strategized with the help of the tool, and by
strategizing it, we get the resistance line where the price from the
downside touches the trendline and falls down. Basically, the line is
slanted; it is neither vertical nor horizontal.
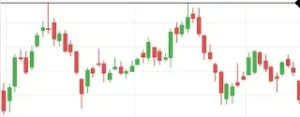
Trendline resistance line - Horizontal resistance: it is the same as the support, but the difference is that the line is
stretched at the upside of the price to determine the resistance
level.
Horizontal resistance line
According to the above mention of resistance, the most commonly used is
horizontal resistance. It is easy to use and easy to determine the level of
resistance.
horizontal resistance. It is easy to use and easy to determine the level of
resistance.
The majority of the traders are of the view that the stocks, or any stocks,
react between the support and resistance levels. Everything happens between
these two levels.
react between the support and resistance levels. Everything happens between
these two levels.
How do we normally buy and sell using the support and resistance levels?
As far as we have learned, when the price comes to the support level, we
should be going to buy the stock. And
should be going to buy the stock. And
Whereas we sell the stocks when the stock reaches the resistance level.
That’s all we normally do, with the help of the support and resistance
levels.
levels.
But wait, there is one glitch in this, and that is that support and
resistance levels are not always going to work, as there are times when the
stock, after touching the support and resistance levels, is not going to
take support or resistance.
resistance levels are not always going to work, as there are times when the
stock, after touching the support and resistance levels, is not going to
take support or resistance.
Let us talk about two cases where the support and resistance levels worked
and where the support and resistance levels did not.
and where the support and resistance levels did not.
Example 1: We have taken an example of the reliance stock, where the
support level is at 400 and the resistance level is at 420.
support level is at 400 and the resistance level is at 420.
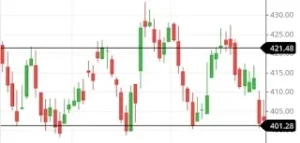 |
| Support and resistance worked |
It was a profitable trade, as we normally use the support and resistance
levels without any other tool or strategy; we use only support and
resistance, placing our orders at support 400 and selling at 420 without
judging anything.
levels without any other tool or strategy; we use only support and
resistance, placing our orders at support 400 and selling at 420 without
judging anything.
Example 2: From the lesson above, we have learned that we have done
the same thing here, but this time support didn’t work, nor did resistance.
the same thing here, but this time support didn’t work, nor did resistance.
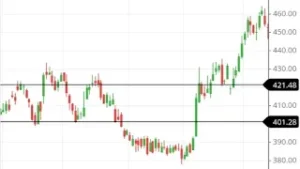 |
| Support and resistance did not worked |
We are trying to teach you all that simply following support and resistance
is not always going to work. It may be working sometimes, but not always. To
increase its accuracy, we had to implement a strong strategy to fully
utilise support and resistance.
is not always going to work. It may be working sometimes, but not always. To
increase its accuracy, we had to implement a strong strategy to fully
utilise support and resistance.
Support and resistance in themselves is a big chapter one cannot learn
entirely and use in their trades.
entirely and use in their trades.
The simple way to use them is to make the chart simple, not complex, with
lots of tools and indicators, and scrape the chart with them.
lots of tools and indicators, and scrape the chart with them.
What is the support and resistance strategy?
The strategy that we are going to use in the usage of the support and
resistance levels is a special candlestick pattern in accordance with the
support and resistance levels that will boost the accuracy to 200%.
resistance levels is a special candlestick pattern in accordance with the
support and resistance levels that will boost the accuracy to 200%.
As we have discussed above, we use support and resistance in a normal way,
but if we use them with a bullish engulfing pattern at the support level,
then it will somehow increase the support level trading double.
but if we use them with a bullish engulfing pattern at the support level,
then it will somehow increase the support level trading double.
For example, in this chart below, we have taken a support level with
a bullish engulfing pattern, and it shows how it nicely reacted.
a bullish engulfing pattern, and it shows how it nicely reacted.
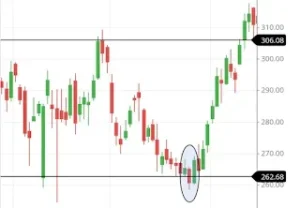 |
| bullish engulfing at support level |
Another way of trading resistance levels that will double the accuracy of
resistance level trading is to use the resistance level with a bearish engulfing candlestick pattern.
resistance level trading is to use the resistance level with a bearish engulfing candlestick pattern.
For illustration, consider the example of resistance level trading
shown below.
shown below.
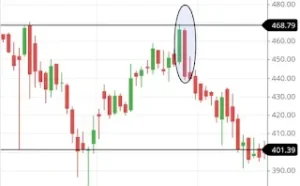 |
| bearish engulfing at resistance level |
Remember, engulfing patterns are made with two candles, and the
stoploss should be below the low of the first candle of the bullish
engulfing and above the high of the first candle if it is bearish engulfing.
stoploss should be below the low of the first candle of the bullish
engulfing and above the high of the first candle if it is bearish engulfing.
Conclusion
Using support and resistance with the engulfing pattern really works and
gives a decent profit if done with consciousness.
gives a decent profit if done with consciousness.
It should be highly considered that any strategy or any special pattern will
only work if it is used with money management and patience.
only work if it is used with money management and patience.
We cannot judge any strategy by using it only one to two times; it should be
used at least 100 times to determine its accuracy and effects.
used at least 100 times to determine its accuracy and effects.
For more queries, please let me know in the comment section below.
FAQs on support and resistance strategy
Frequently asked questions on support and resistance levels.
- Are support and resistance levels indicators?
- No, it is not an indicator; rather, we use it with tools like
horizontal lines, and sometimes we judge it on indicators like
moving averages.
- No, it is not an indicator; rather, we use it with tools like
- Are support and resistance levels indicators?
- What strategy has already been discussed?
- The bearish and bullish engulfing patterns with traditional
support and resistance level strategies have been discussed
above.
- The bearish and bullish engulfing patterns with traditional
- What strategy has already been discussed?

