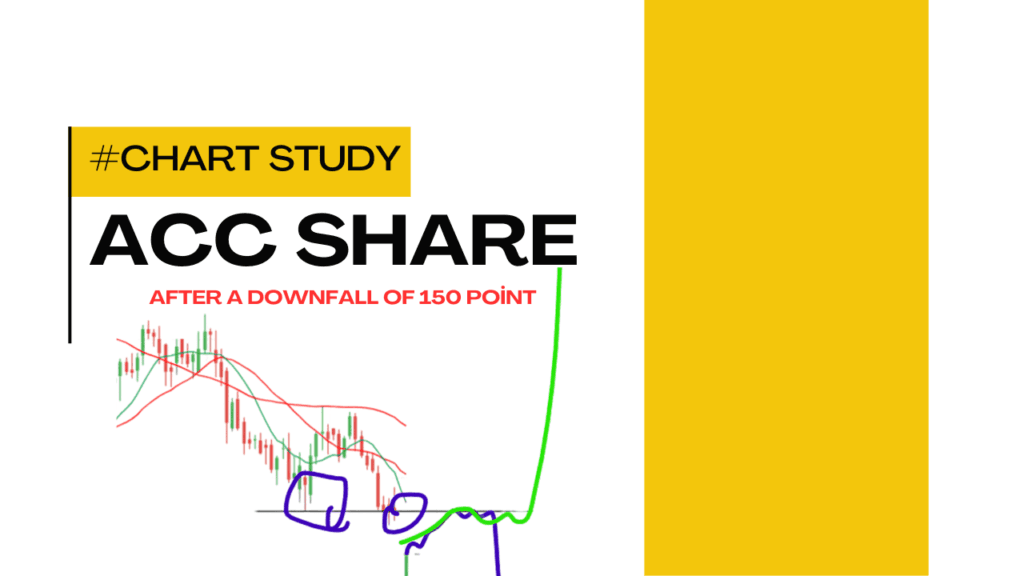
Are you looking to know, what the technical analysis of Acc share tells us?
Let us try to read and study the chart of Acc share.
We will wholly try to read the chart on a technical basis only and find out the possibility that the chart tries to tell us and, on that basis, we try to take our decision and see whether it works or not.

No study or analysis is 100 percent correct. Therefore, we can make mistakes and learn from them, and they should be repeated again and again.
Acc share after closing at 150 points down
The share closed 150 points from the previous close on Thursday 21st September.
The share tries to surge up and the figures in green display the upward movement in stock.
The previous opening on Thursday was in 1986, with a closing figure 2027.2. The high and low were 2052.3 and 1868.2, respectively, with an engagement of 3.49 M people.
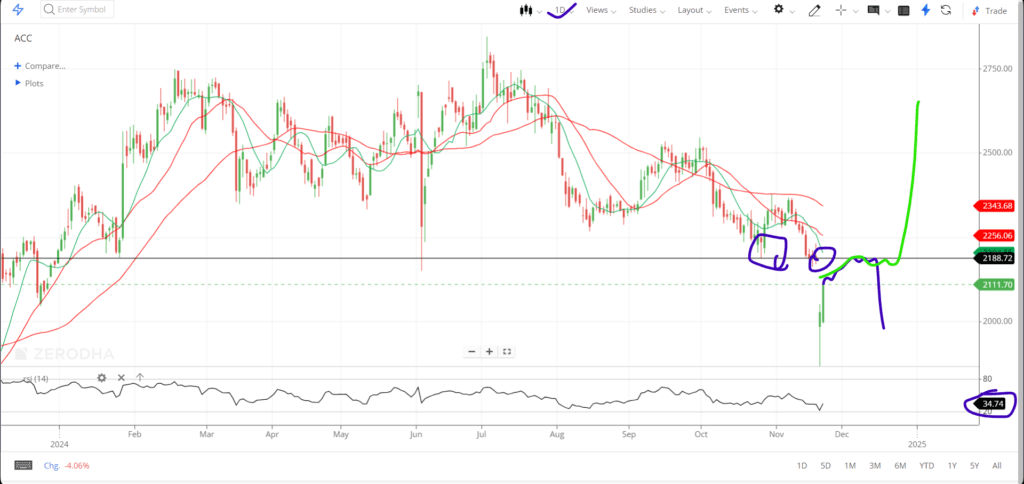
The stock topped recently this November at around 2350 to 2360 price and after that, it fell heavily, making a recent low at around 1900 yesterday on Thursday.

Technical analysis of ACC Share
Our technical analysis will be based on support and resistance, moving averages, chart patterns, candlesticks, and RSI.
Support and Resistance of acc share
Let us find out the support and resistance of acc share in the chart on a timing basis so that it can be easy for the traders, who are trading or looking to learn to get the support and resistance figure based on their suitable timings.
For a chart on day timing: the resistance level which is coming out in day timing is around the 2160 to 2200 price level, it may react as a strong resistance level as the price is coming after an instant downfall on Thursday 21st November.
For a chart on 15-minute timing: The resistance at 15-minute chart seems to be similar to that of day timing which is around at 2200 price level and the support is at 2050.
For a chart on 5-minute timing: The same as in the 15-minute chart.
Moving average of acc share
The moving average of acc share in the day timing chart displays a bearish trend in the market whereas the 15-minute and 5-minute charts show a positive sentiment in the stock.
In day timing the 21-day Moving average is above the 10 days MA and in the 15-minute and 5-minute charts the 10 days MA is above the 21 days MA.
As a result, we may be cautious if we are planning to take trade in intraday as the chart may be showing a positive trend upside in 15 and 5 minutes respectively but in day timing it is still a talk in the market about its buying intention.
One of the worst things that the moving average is displaying is that the 50-day MA is far above the stock price because of the sudden fall that the stock has seen this Thursday which shows a bad impression on the traders or on the holder of the stocks.
Chart pattern
The chart pattern of Acc share seems to be a pattern that has a downside falling movement and tends to display the bearish sentiment in the stock.
As if the trendline is stretched. It will provide a line from up to downside movement and if breakout a possible upside trend can be seen in the future.
Candlestick
On Thursday 21st November the candlestick of acc share was a hammer-like candle which has a long tail at the down with a small wick at the top and a small body, creating a bullish sentiment in the market.
Basically, the hammer candlesticks are traded when the next candle breaks the high of the hammer candle and on Friday 22nd November the candlestick broke the high of the previous candle which was a hammer candle.
RSI
The RSI of the acc share is at around 34 on day chart timing and on 15-minute and 5-minute the RSI is at around 61 and 59 respectively.
It means that if the RSI is at around 80 then it is at the oversold level and if around below 20 then it is at the overbought level.
But most traders have their own way of trading with RSI and the most common of trading the RSI is buying when it is above the 40 level mark and selling when it is below the 80 level mark, but still it differs as it depends on the experience with RSI one has.
It is always better to use something with RSI to polish confidence in using the RSI.
Let us recap what the Acc share told us till now.
After checking the support and resistance of Acc share we got to know that the share is reaching the resistance level which was around the 2160 to 2200 price level, Selling pressure may start.
Moving average disheartens the bullish nature and tells us to keep away from the stock with the buying intention.
The chart pattern has a downside movement flow.
The candlestick pattern makes a bullish hammer with the breakout of high in the next candle.
RSI has a decent figure of around 34 which can be seen as a buying intention from a long-term perspective.
Conclusion
The technical of the Acc share is not up to that level where one can be satisfied in buying, for buying the technical should be enticing.
But from a long-term perspective, the share is good. For those who are looking for a short-term trade, waiting for a good opportunity is always nice and better for making profits in stocks.
Hoping that this December the stock will rise and give us a good chance where we can be confident about it and go for bullishness in the stock.
Buying and selling of the Acc share should be neglected for a while and position should be commenced when the better chance is shown.


