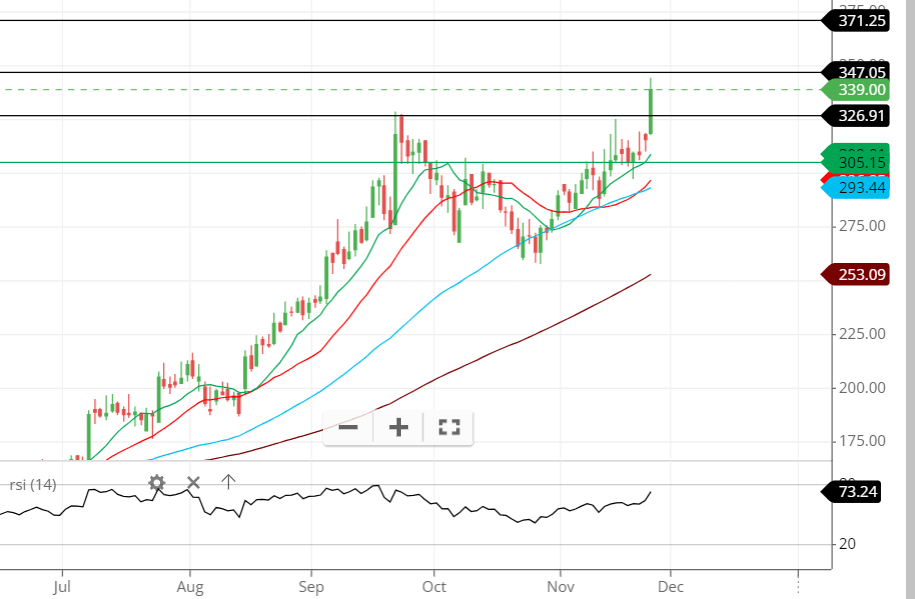
Marksans comes under the Pharmaceuticals & Drugs sector, as it is one of the stocks performing very well after the lockdown.
Recently, it broke its high, which was an all-time high on Tuesday, 26th November 2024.

Its previous high was in September 2024 at 328.8. After falling 80 points below, it surged once again today, breaking all the stock’s norms.
Today, the stock surges to 8%, which means a rise in price of above 20 happens. Now the price stands at 335 price.
Technical analyzation
Technical analysis of Marksans will provide us with a good idea of the stock’s long-term performance, so let’s see what it tells us technically.
Moving average
If we look at Marksans’ monthly chart, we will find that the stock is performing outstandingly with regard to the SMA we put on the chart, which can be a 50-day SMA, a 20-day SMA, or even a 100-day SMA.
Even in the day chart, the stock is above the 20, 50, and 100 SMA lines, indicating strong bullishness at the present time, which makes buying a possible option.

Even the crossover is well organized in the stock at the present time, giving the lovers of crossover traders a good opportunity to go for the stock now.
RSI
Currently, the stock is at around 73 RSI, which is well enough to buy as it is on the verge of reaching the overbought level.
Most traders look for an RSI level of around 60 to 70 to include in their portfolio. From a short-term perspective, we will see a good increase in the stock from 4% to 10%, which should be enough for any trader.
The RSI indicates a strong bullishness in the stock, which can entice traders and investors to invest in it both in the short term and in the long term.
Support and resistance
The stock broke its previous resistance, which was around 325 today, and the next resistance could be around 347, 371, and 394.
The support should be around the previous resistance level, which will react as support now at level 328, 305 price.
Candlestick and chart patterns
If we talk about the candlestick today, as the stock surges to above 8%, a big green candle is made with a small wick at the bottom, indicating the excellent strength of the buyer in the stock right now.
The candle seems to be a marubozu candlestick with over 7 million participants in the stock.
As of yesterday, 25th November 2024, the candlestick was a bearish red hammer candlestick, which means that if the next candles break it high, the possibility of going high would be there.
On the other hand, the chart patterns are like a pattern where the stock rises and then consolidates, absorbing the sellers for the time being and breaking out to make a new high.
See, there are many patterns to remember, and going out for them is not possible for anybody. But one thing every pattern does is provide us with an indication of the breakout, as chart patterns are nothing but the future indication of the breakout or breakdown.
Final analyzation
The RSI, moving average, chart and candlestick patterns, support, and resistance all indicate strong bullishness in the stock, which means a strong surge on the upside is likely in the near future.


