Rubymills’ share falls under the Textiles & Apparel sector. It is one of the stocks that constantly moves in a zig-zag pattern, where the stock goes down and then goes up.
The stock fell after touching a high of 295 on 27 November 2024. The low is 271.10, the open is 274, and the close is 287.66.

Rubymills’s revenue is 51.28cr, a quarterly figure for September. It is a -3.51% yearly change, with a net income of 445.43M (yearly) and a +26.45 % yearly change.
EBITDA stands at 550.66M, which is +7.71% high yearly.
Technical analyzation
Let us examine Rubymills’ technical data to determine how the stock will react in the long run and whether it will go upside down or downside.
Moving average
Let us then find Rubymills’ technical data using moving averages. We will use the 50-day SMA, 21-day SMA, and 10-day SMA.
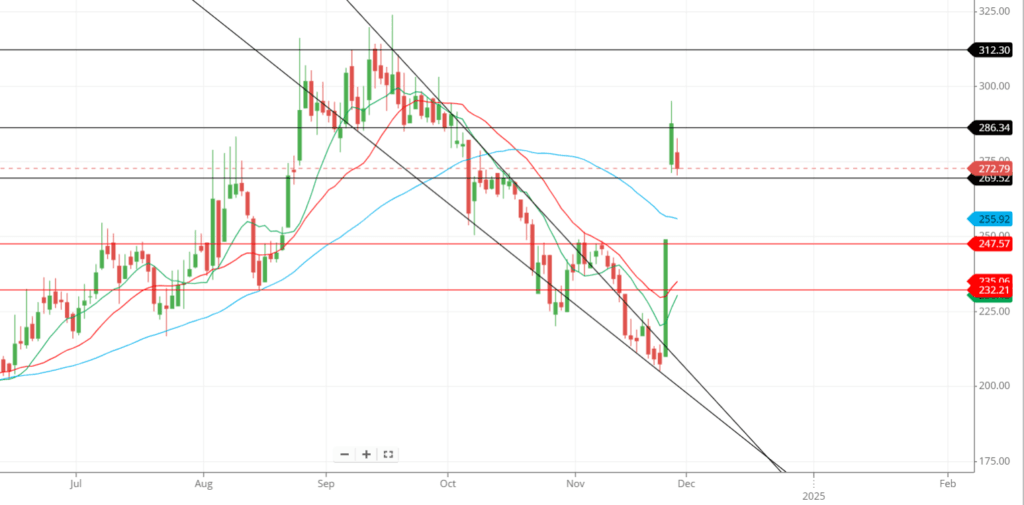
The 50-day SMA is around 255 rupees, the 21-day SMA is around 235, the 10-day SMA is around 230, and the price is around 272.
If we take the gist out of everything, we will find that the moving average lines are below the price level, which indicates a strong bullishness in the stock for the time being.

But the moving averages are not in line. For example, they should be like these: The first line of the SMA below the present price should be 10 days SMA, followed by 21 days SMA and then 50 days SMA.
But here in the chart, the moving average lines are in reciprocal order, which is not good for the stock to move in the upside direction because it will always tend to move downside, as the reversal moving average lines will pressure it to move downside.
The moving averages are not confident enough to make the stock move in the upside direction.
Support and resistance
The stock came down after hitting strong resistance at around level 285, and it seems that it will touch the nearest support line at 270.
The second support line is around 250, near the price the stock jumped to hit the second nearest resistance line.
It is also a crucial line, which makes it strong support, too, because after the close of the candle on 26th November 2024, the stock gapped up, and there will be pressure to hit the close of that candle as the stock is trying to come down.
And the third support line is at around 234.
The resistance lines are at around 285 and 310, respectively. Remember that there could be pressure around the price of 300.
Candlestick and chart patterns
The candlestick pattern on 25th and 26th November 2024 makes a bullish engulfing pattern. Today, on 28th November, if the candles close below yesterday’s low, there will be a bearish engulfing pattern, which means the stock will likely go down afterward.
In contrast, in the chart pattern, the stock moves from the uptrend to the downtrend, breaking the trendline to move to the upside.
It seems to be a channel-down pattern, which indicates the continuation of the bullish trend after the downtrend.
Last thought
The moving average is not interested in taking the stock to the upside. The support line is active and can go either side, and the candlestick is also less interested in making an upside move.
On the other hand, the chart pattern only indicates an upward movement. If the stock is held for some time, it could result in an upside direction.


Venture into the epic universe of EVE Online. Start your journey today. Create alongside millions of explorers worldwide.