DJ Mediaprint & Logistics Ltd comes from the Media and Entertainment sector and is involved in the media industry.
As of September 2024, the public holding for DJML shares remains at 43.13%.

Some of the crucial standalone figures as of the year 2024 are:
- Earning per share (EPS) remains at 4.65
- ROE is 15.02
- Total income is 57cr. With EBIT remaining at 2cr.
- Total expenditure is 48cr and the net profit remains at 5cr.
- Reserves and surplus are 22cr.
The opening price for November 2024 was 117.11, the high was 151.5, the low was marked at 109.4, and the close remained at 109.4.
We have the fundamental figures, which are pretty interesting, and no serious issues have been seen.
Let us examine some technical analysis figures to strengthen our judgment about whether the stock will double this December.
Technical analysis
Let us begin our technical analysis based on the RSI, support and resistance, chart pattern, candlestick type, and trendline.
RSI
The stock’s all-time low, hit in February 2023, was 40.05, and its all-time high today, 2nd December 2024, was 161.99.
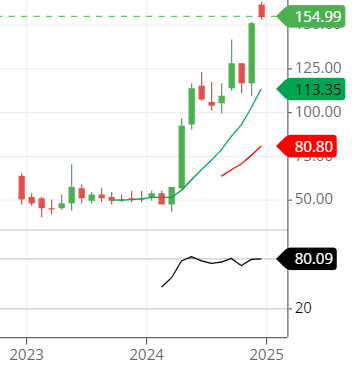
The stock continuously rises, so the RSI is around level 80. This level is too high for any stock to expect an ongoing upside trend.
Nevertheless, the RSI doesn’t recommend us buying right now as it is very high; we should wait for the RSI to come down a little, and then buying should commence as per the RSI rules generally portray.
Support & Resistance
The stock closed above its high resistance of around 125 in November.
It was expected that the stock might hit the high made by the stock at around the price of 140, but that was crossed above it and even closed above it, displaying the strong bullishness in the stock.
The present stock support and resistance which comes out are:
Remember that these all are for monthly chart view perspective, and they are:
Support level: 140, 130 and 122.
Resistance level: 175,196 and 222.
Meanwhile, the chart regarding support and resistance shows great bullishness in the stock.
Chart pattern
The chart pattern for DJML shares displays a great price movement as it makes higher-high and lower-low.
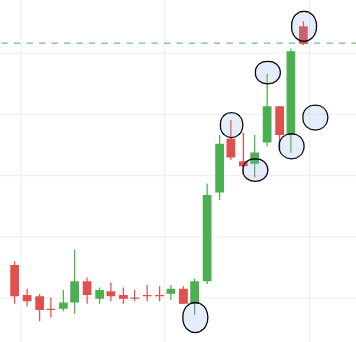
The past four candlesticks on the monthly chart show that three out of four are green, representing strong bullishness in the stock.
Candlestick
If we look at the chart for the third and fourth months of 2024, we will find that the share made a bullish engulfing pattern, and from there on, the stock moved upside down.
The previous two-month candlestick made the same engulfing pattern, meaning the share might repeat the pattern.
Trendline
The trendline for the DJML share on the chart represents the solid bullish trend ongoing in the chart, and the chart could break its high made today, December 2nd, 2024.
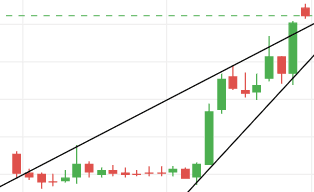
The downside trendline provides support, and the upper side trendline, instead of providing resistance, is interested in supporting the chart of DJML share.
After analyzing the chart of DJML shares using Trendline, it is not wrong to say that the share might enter a strong bullish zone for the upcoming days.
Aftermath
Based on technical and fundamental analyses, the stock seems strong enough to buy. Still, it is highly recommended that we pay close attention to the related company’s ongoing elements.

