GARUDA share comes under Construction materials and is included in the cement and Construction Materials.
GARUDA share got listed on 15 October 2024. GARUDA is a civil construction and engineering company based in Mumbai.

As of October 2024, the public holding for GARUDA (Garuda Construction and Engineering Ltd) share remains at 17.50%; the promoter has the most significant percentage of share, which is 67.60% as of October 2024.
Some of the crucial standalone figures as of the year 2024 are:
- Earning per share (EPS) remains at 4.87
- ROE is 30.61
- Total income is 154cr. With EBIT remaining at 49cr.
- Total expenditure is 104cr, and the net profit remains at 36cr.
- Reserves and surplus are 81cr.
- Net cash flow is -4.
The price for the GARUDA share on 4th December 2024 is as follows:
Open – 96.69, High – 104.15, Low – 94, close – 103.06.
As the market is open now, on 5th December 2024, the stock price hit a high of 107.50 and came down.
Technical analysis
After discussing some of the fundamentals of GARUDA share, let’s discuss the essential figures of technical analysis.
Our technical analysis will be based on support and resistance, chart and candlestick patterns, and the SMA (simple moving average).
Support & resistance of GARUDA share
It is one of the tests that everyone does to ensure the ongoing trend and happenings of the stock.
The chart shows that after hitting the resistance line at around 106.50, the stock respected it and came down.
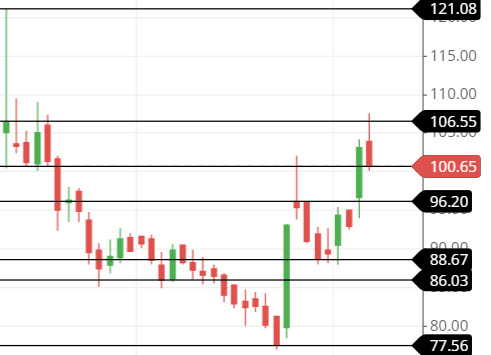
One good chance is that if the candlestick closes above the resistance line at around 107, the prices of 115 and 120 could be seen.
The next three support and resistance lines, which are around levels, are:
Support – 100.50, 97 and 92.
Resistance – 106.50, 115 and 120.
After analyzing the support and resistance lines, we could say that if all goes well, the stock will likely go upside down in the upcoming days.
Chart & candlestick pattern of GARUDA share
Candlestick pattern—The stock on 29 November and 2 December 2024 combined to form a bullish engulfing pattern, and it did the same on 3rd and 4th December 2024.
The stock is making a bullish engulfing pattern, which means that upside movement will be possible in the upcoming days.
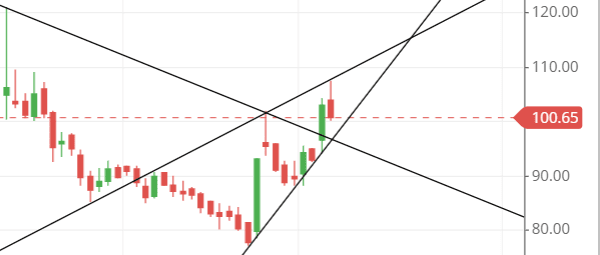
Chart pattern – The chart pattern seems to be an Ascending Triangle.
If it makes an Ascending Triangle, the stock might break, and the bullish trend might continue.
An ascending Triangle means the stocks rise within the trendline stretched below and above.
GARUDA shares SMA (simple moving average) lines
We have two lines of SMA, which are simple moving average lines, and they are:
The green is 10 days SMA, and the red is 21 days SMA.
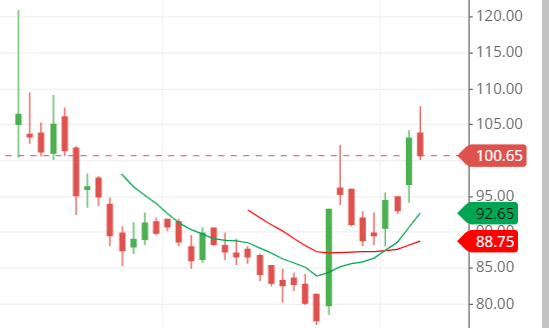
As the stock is newly listed, using a more extensive day’s SMA on the chart is worthless because it only gives figures from the recent past, and again, repetition would not be accurate.
The moving average lines on the chart are crossing over, which means that the 10-day SMA is over the 21-day SMA.
This is a good chance to buy the stock according to the SMA lines shown in the chart.
Last thought
The stock seems excellent for investing and trading perspectives, and its price could significantly change in the coming days.

