Adani’s power share falls under the power sector and is included in the power generation/distribution industry.
The company’s primary work is to supply power and deal with electricity projects.

As of September 2024, the public holding for Adani’s power share remains at 10.84%; the promoter has the most significant share, 74.96%.
Please note that DII (Domestic Institutional Investors)has 1.52%, and FII (Foreign Institutional Investors) has 12.66% shareholding.
A diverse shareholding pattern makes a good shareholding pattern, and the Adani power has that, which is very interesting to look for when investing.
Some of the crucial standalone figures as of the year 2024 are:
- Earning per share (EPS) remains at 46.24; in 2023, it was 23.32.
- ROE is 58.79, while in 2023, it was 69.4.
- Total income is 11031 cr. With EBIT remaining at 3575 cr.
- Total expenditure is 7455 cr., and the net profit remains 2409 cr.
- Reserves and surplus are 28029 cr.
- Net cash flow is 366.
The company figures are too enticing and engaging to invest in.
The price for the Adani power share on 11th December 2024 is as follows:
Open – 527, High – 530.55, Low – 520.65 and close – 522.30.
As the market is open now, the prices may differ after closing.
Technical analysis
After an outstanding figure of the company’s fundamentals, let us now explore some of the figures that the technical analysis will provide us with to better understand the stock’s present and future.
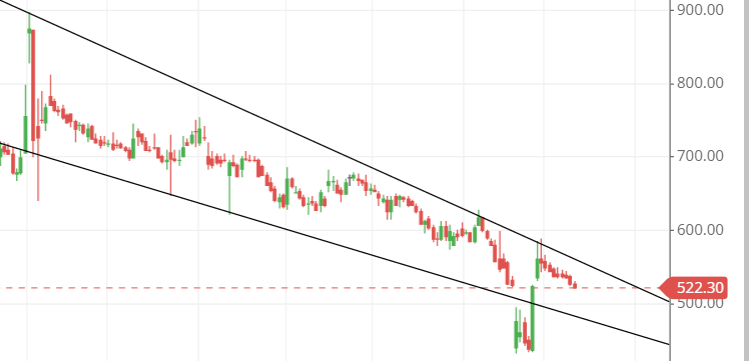
What is the trend of Adani power share according to the trendline?
The trendline shown in the chart indicates that the stock is in a downtrend movement.

Because the trendline flows from up to down, it creates a bearish sentiment in the chart, with sellers being heavy on buyers until the trendline is cut and the prices move above it. No trades should be executed to the upside.
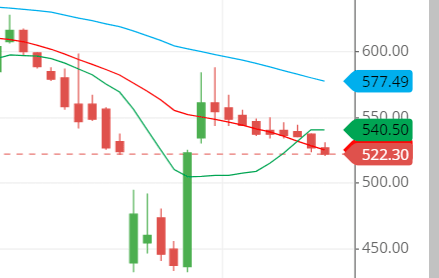
Adani Power shares SMA (simple moving average) lines.
The moving averages of the Adani power are also not so cool for the long side of the trade.
The blue line indicating the 50-day SMA is above the stock’s price level.

The 21-day SMA (red line) is at the price level, and the prices are moving towards it, while the 10-day SMA (green line) is above the price level.
Overall, the SMA (simple moving average) lines are messed up, and making any judgment based on that would not be accurate, especially when deciding on the upside.
Support & resistance of Adani power share
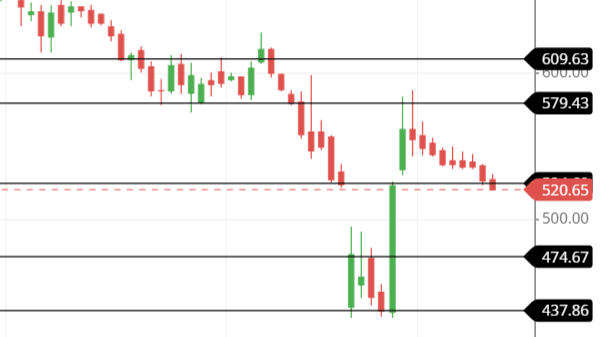
The price of Adani Power is currently on a strong support level, and there is a chance of it breaking because of the trend shown by the chart, which is a downtrend movement.
The chart does not show much interest in going to the upside because the price is in a downtrend and below the moving average, and many bearish candlestick patterns occurred at the same time.

The three support and resistance levels are:
Support – 522, 475 and 438
Resistance – 579, 609, and 625.
It is possible that the stock will touch the support levels rather than the resistance levels.
Chart & candlestick patterns of Adani power share
Candlestick pattern: For the past five days, a kind of Inverted hammer has been making itself, which indicates the bearish movement in the stock.
Chart pattern—a kind of bearish chart pattern is on the go and in the making, which is pressuring the stock to flow on the downside.
Last thought on Adani’s power share
Let us be frank: The technical figures are enticing enough to make anyone consider long-term or short-term trading.
The fundamental figures are good, and one can decide to invest in the stock for future growth.


