BAJEL shares fall under the Capital goods sector and are included in the Engineering (construction) industries.
Bajel Projects Limited (BPL) is involved in the Engineering, procurement, and construction business.
As of September 2024, the public holding for BAJEL shares remains at 28.58%; the promoter has the most significant share, 62.61%.
Please note that DII (Domestic Institutional Investors)has an 8.3% shareholding, and FII (Foreign Institutional Investors) has a 0.5% shareholding.
Some of the crucial standalone figures as of the year 2024 are:
- Earning per share (EPS) remains at 0.37; in 2023, it was -0.14.
- ROE is 0.75, and in 2023 it was -0.29.
- Total income is 1194 cr. With EBIT remaining at 22 cr.
- Total expenditure is 1172 cr., and the net profit remains 4 cr.
- Reserves and surplus are 543 cr.
- Net cash flow is 45.
The stock is not too old. It was listed on December 19, 2023, and opened at 200 and closed 10 points below the price of 190. The interesting thing is that it closed at its low cost, and after that, the stock hit a few lower circuits.
The price for the BAJEL shares as of 14th December 2024 is as follows:
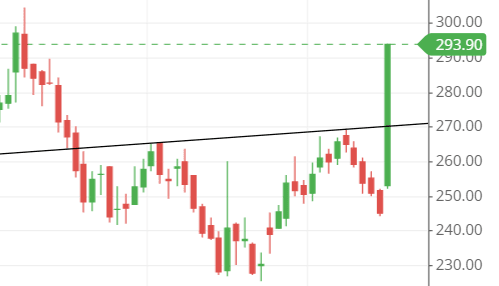
Open – 252.95, High – 293.90, Low – 252.05 and close – 293.90.
The high remains close, indicating that the stock might be touching its nearest round figure 300.
Technical analysis
After learning the fundamental figures of the BAJEL share, let’s analyze some of the crucial technical figures of the stock by going through the chart.
What is the trend of BAJEL share according to the trendline?
After analyzing the chart, we can judge that the stock has cut the upper trendline.
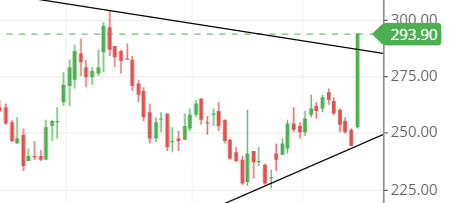
The stock might go upside down as it moves towards the upper side of the upper trendline, which was previously stretched on the chart.
BAJEL shares SMA (simple moving average) lines.
The chart shows that the green SMA line, which is the 10-day SMA line, has cut the blue SMA line, which is the 50-day SMA line, and gone up. Thus, the moving average trend is bullish, and after the crossover between the green and blue, the stock confirms the bullish sentiment in the market.
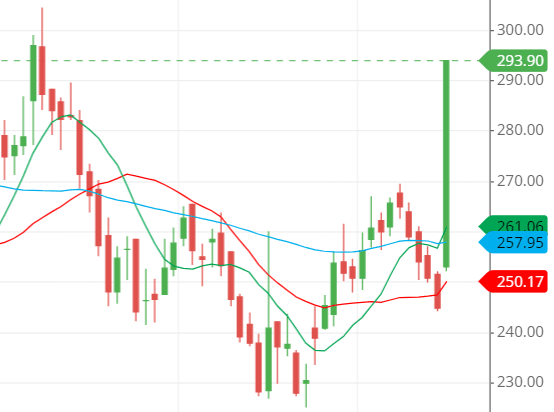
The 21-day SMA line, which is red, remains at the bottom of the two lines, indicating instability in the market because the SMA lines are not in ascending order. After the 10-day SMA, the 21-day SMA should be there, but the 50-day SMA interferes between those two lines.
Support & resistance of BAJEL share
The stock’s support and resistance lines are close to each other because of the sensitive area it created in the previous days.
The stock recently broke the resistance lines of 275 and 285 simultaneously and is moving towards the 300 figure, which is the strong resistance line because it is a round figure, and many kinds of psychology are involved around that figure.
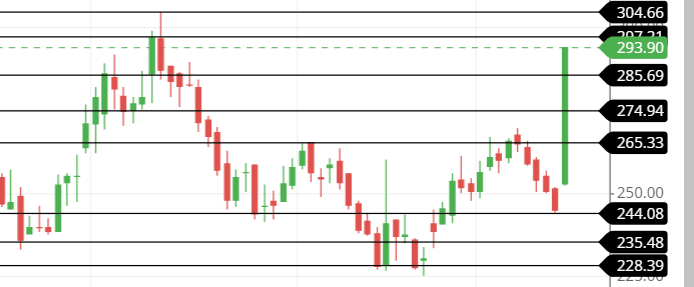
Look at the chart carefully to learn about its support and resistance levels.
Chart & candlestick patterns of BAJEL share
Candlestick pattern—The stock has created a bullish engulfing pattern, but the only disturbing thing is the present green candle, which is too large to say it is a good bullish engulfing pattern.
When this kind of candlestick gets formed, the other candles that follow it are usually small and in the correction phase.
Chart pattern: The stock has created the inverted head and shoulder pattern, a trend reversal pattern that indicates a bullish reversal in the stock for the time being.
Last thought on BAJEL share
The stock’s price was 200 at the time of listing, and now it is almost 90 points above that in the previous year.
The stock shows some potential to go upside. It is us on whom this stock depends. In the long term, the stock seems to be performing decently.


