SUNDRMBRAK shares fall under the Automobile & Ancillaries sector and are included in the Auto Ancillaries (Brakes) industries.
SUNDRMBRAK (Sundaram Brake Linings Ltd) mainly works in automotive, non-automotive, and friction-based materials.
As of September 2024, the public holding for SUNDRMBRAK shares remains at 34.44%; the promoter has the most significant share, 65.54%. Others got 0.01% shareholding.
Please note that FII (Foreign Institutional Investors) has a 0.01% shareholding, while DII (Domestic Institutional Investors)has a No shareholding in the stock.
A question always remains active when the DII has no holding in any stock.
Some of the crucial standalone figures as of the year 2024 are:
- Earning per share (EPS) remains at 25.65; in 2023, it was -12.15.
- ROE is 10.61, and in 2023 it was -5.59.
- Total income is 355 cr. With EBIT remaining at 14 cr.
- Total expenditure is 340 cr., and the net profit remains 10 cr.
- Reserves and surplus are 91.
- Net cash flow is 0, as it was the same in 2023.
The price for the SUNDRMBRAK shares as of 21 December 2024
Open – 1130.65, High – 1148.90, Low – 1031, and close – 1055.45.
Technical analysis
After getting the improved fundamental figures, let us now get some technical figures to judge what the stock will do in the near future based on the data we get through chart reading.
What is the trend of SUNDRMBRAK share according to the trendline?
The stock’s present trend is in an uptrend as the stock jumped from the previous low of 748.10 and is now touching the recent high of 1207.85, almost a gain of 250 points from low to high.
After touching the recent high, the stock has now gone to the correction face, and as the market has been falling for a few days, the stock reacted less than the fall of the market.
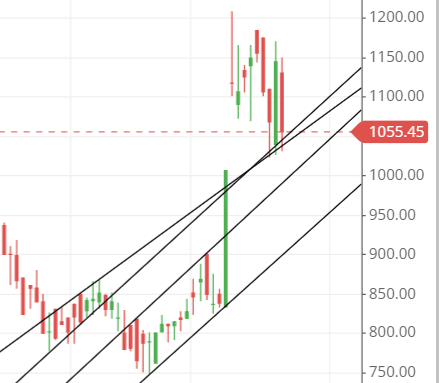
As in the chart, the trendline is a little messed up but the stock cut every possible upside. The trendline became bullish once again after a previous fall.
SUNDRMBRAK shares SMA (simple moving average) lines.
Blue line – 50-day SMA; Red line – 21-day SMA; Green line – 10-day SMA.
After seeing the moving average line in the chart, the doubt about the stock trend clears up as it clearly shows that the stock is now ready to go upside down for the time being.
The stock price in the chart is above the two SMA (simple moving average) line, indicating the strong bullishness in the stock where the buyers are heavy on the sellers.
Not only that, but the structure of the SMA lines is perfect with the lines directed upward.
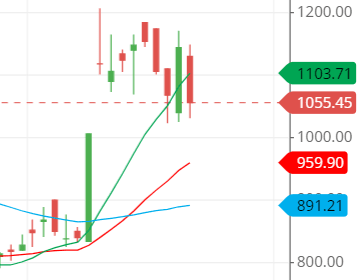
The only thing is to see whether the stock will go upside the 10-day SMA, which is green in color in the next candle, and if it does, the positive sign will be indicated for the traders.
Support & resistance of SUNDRMBRAK share
As the chart suggests, the stock is looking to go down to reach the nearest support line, which is around the price level of 950.
But still, it is hanging on the level of around 1075, as the stock may change its direction if it gets closed above the 1150 level.
Until the stock is attached to the level of around 1075, any prediction would not be correct.
Through the support and resistance, we can get a little confused about what will touch the first, whether the support will come first or the resistance level, but it is confirmed that the support and resistance shown are strong, and they will try to push the price to its side.
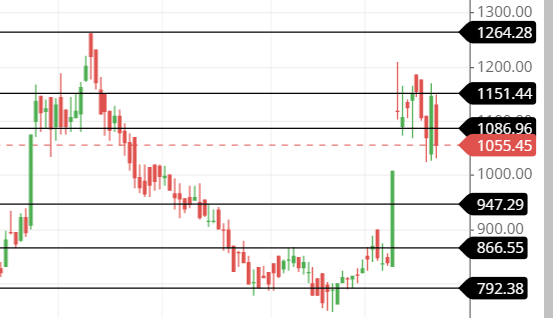
The three possible support and resistance levels are:
Support – 1005, 950, and 900.
Resistance – 1094, 1150, and 1200.
Chart & candlestick patterns of SUNDRMBRAK share
Candlestick pattern – The candlestick pattern made on combining the 18th and 19th December 2024 was a bullish engulfing candlestick pattern, a bullish indication sign. Still, the form was unacceptable as of 20th December 2024; the stock never crossed the high made by the stock on 19th December 2024.
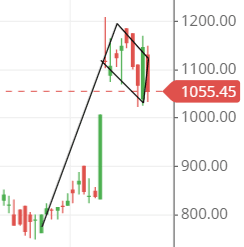
Chart pattern – The bullish Flag pattern is what the stock is processing and making as after the jump from the downside, the stock is now consolidating, and it is likely to move upside down based on the moving average and as the trendline suggests.
Last thought on SUNDRMBRAK Share
The stock fundamental gets better with time and technical figures of the present situation of the stock are too enticing for the buyers to let the stock move to a new price level.
With good stop loss and target, short-term trading can be commenced, following the support and resistance figure mentioned above.

