Do you want to learn how it happens? And how to follow it in another stock by making a similar pattern so that you, too, can benefit from it.
Yes, it happened in the ASHAPURMIN stock in the metals and mining sector.

We are talking about the technical aspects of the stock, so we will learn how it happens in the chart study and what causes it to jump so densely within 2 weeks, causing that many points to occur.
All studies should be based on the technical research itself and nothing else.
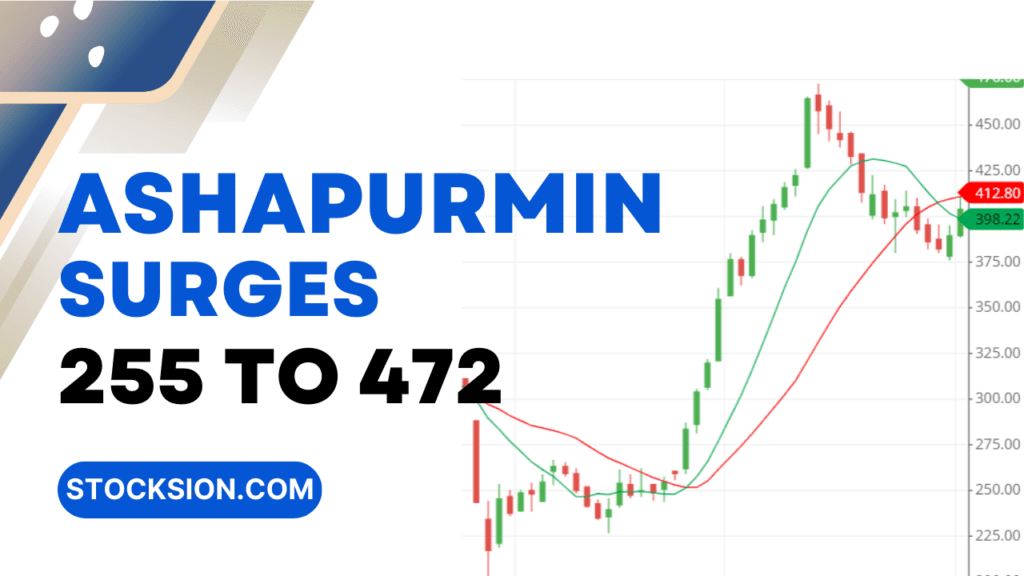
We will try to analyze what happened on 25th November 2025. It rallied continuously to make a high of 472 points from 255 points, suddenly making a higher high to reach that point.
Technical analysis of ASHAPURMIN stock
We will try to learn why this happened, a sudden jerk to gain almost 80%.
To find it, we will look at the Moving average, support and resistance, trendline, and whether the candlestick pattern and chart pattern indicate an early indication.
At the end of this post, we will find out who gave the first indication of the stock’s rise.
Moving average crossover effect
Are you considering whether the moving average crossover has done that?
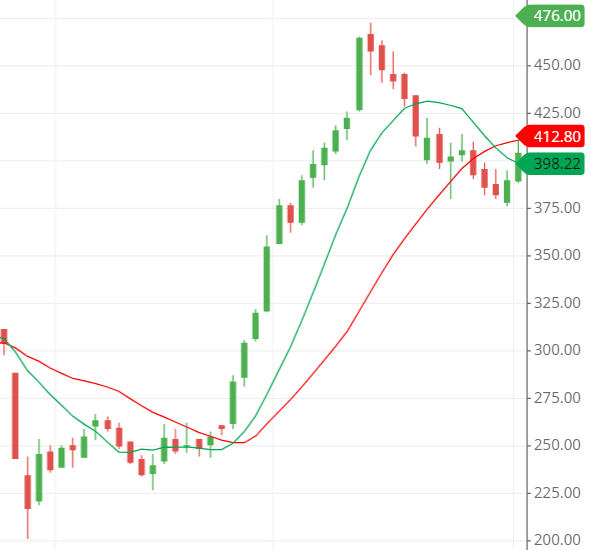
The chart shows that the stock made a moving average crossover on November 26, 2024.
The image shows the crossover of the SMA (simple moving average) of 10 days and 21 days. The green line indicates the 10-day SMA and the red one indicates the 21-day SMA.

If we take the moving average as the source of the jump, there is nothing wrong with that, as the moving average crossover shows that the stock will touch a new high.
The entry and exit that the crossover made, which the everyday traders would be in and out of, were 285.80 and 392.80.
Gaining almost 100 points from 285.80 points. It could be different for different traders as they might be in and out on a different level, and everyone has their way of entering and exiting.
But, indeed, the 100 points went nowhere.
Support and resistance effects on ASHAPURMIN stock
Many support and resistance trading lovers only see the support and resistance lines to enter and exit from a stock.
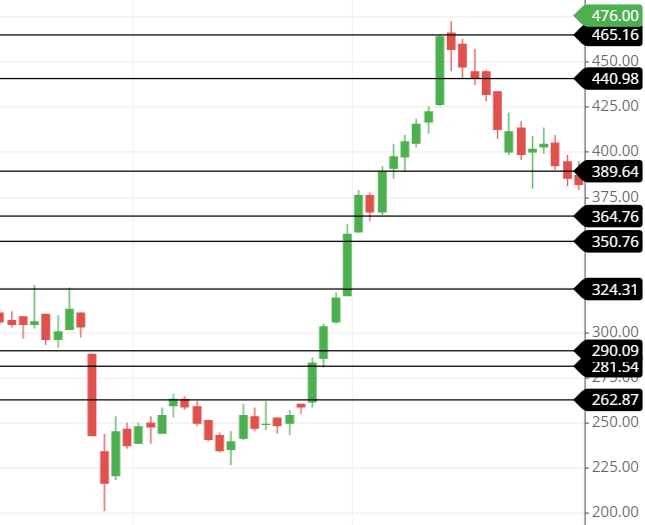
The chart shows that the stock has too many resistance lines and support.
But as the stock started its rally, it didn’t look back until it touched its high around 475.

Breaking only the resistance line without touching the support line if it touches its resistance lines.
The moving average and the support and resistance lines have the same entering position, but the exiting points are slightly earlier than the moving average lines.
Trendline effects on ASHAPURMIN stock
As we can see in the chart, the trendline indication is too late, so I think it’s better not to talk about it. It is useless to talk about something whose indications are late because the price levels are always high around that level, and we should always avoid trading around such a level.
Patterns effects on ASHAPURMIN stock
We will discuss the making of the candlestick pattern and chart pattern here.
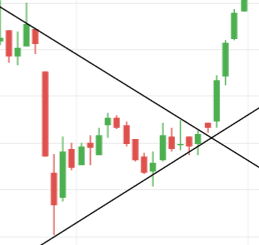
Chart pattern: The chart pattern shows that after a consolidation within the range, as shown in the image, the stock broke upside down and made new highs.

Candlestick pattern: On November 21st and 22nd, 2024, the stock made a bullish engulfing pattern, which tends to make the stock make a new high, as the candlestick pattern indicates bullishness.
Last thought on ASHAPURMIN stock.
As we discussed at the top of the post, we will disclose which tools or indicators first indicated a fantastic trend, and let me tell you all that the candlestick pattern made the first impression of such a trend to come.


