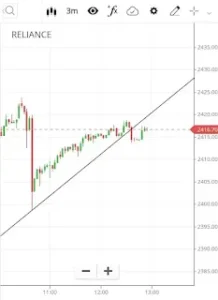
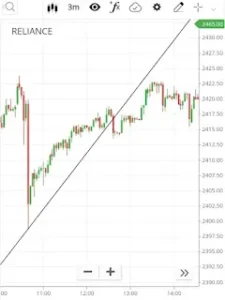
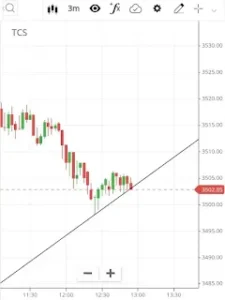
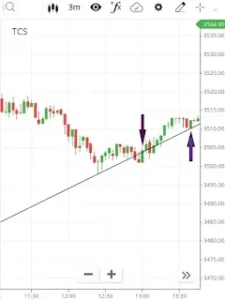
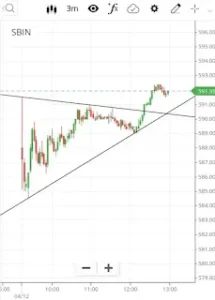
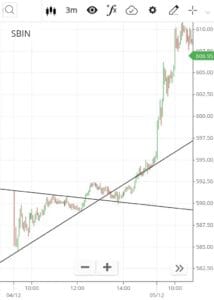
In this post, we are going to discuss all about the magic of the trendline,
the most common indicator in the share market, which is used by almost all
traders.
Whether it is NSE, BSE, Bank nifty, or NASDAQ, anything in India or outside
India, it doesn’t matter what stock is there; trendline works fine anywhere,
wherever you make it.
It is true that there are no traders in the world who don’t use the benefits
of Trendline.
Small and simple things are always beneficial. Whether you talk about the past
or the future, trendlines are and will be beneficial for traders and
investors.
Let us point out all the pros, cons, and factors of using trendlines.
Trendline
You will see many definitions of the trendline on Google, but the fact is that
they are so bulky and big that the main essence of the definition skips
anywhere in that lengthy definition.
As we know, simple things are always very complicated to understand because we
people are so indulged in this mixed-up world that our minds become so narrow
that we knowingly reject understanding the perfect simple way of using or
applying trendlines to our stocks.
Simple meaning of a trendline
- low to lower
- high to higher
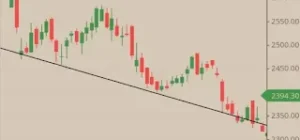
Low to lower: it is not just connecting low to lower; it
seems to be very simple. The newbies get stuck on this. What they think is
that after connecting the lower and upper, the making of a trendline is
complete, but there are lots of factors involved in making a perfect
trendline. Follow these steps before making a trendline that has a
downside:
- Take a line tool and stretch the downside with one point of the line
touching the low and the second point touching the lower-low. - After completion of the first step, check once more whether you have
touched both the low and the lower low of the stock on which you are
trying to make a downside trendline. The making of the downside
trendline is complete.
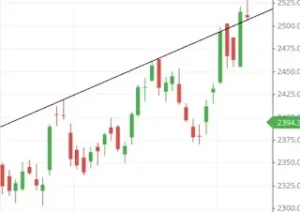
High to higher: as we have done the downside trendline
above, the same procedure has to be followed here to make an upside
trendline, to see the upside movement of the stock. Follow the steps to
make an upside trendline.
- Take a line tool and make sure that you attach one point of the line
tool to a high and the other one to the higher high to complete making
an upside trendline. - After complete making, make sure you check once more to be sure about
the making of the perfect upside trendline.
- [accordion]
- High to Higher
- Low to Lower
Is close important for the trendline?
But the answer is definitely one of the biggest mythbusters among the
traders of today’s world.
candle, then you are going to miss the perfect making of the
trendline. If you think that high and low are important for the making
of the trendline, then you should not forget to see the close of the
candle to be very accurate in the making of the perfect profitable
trade.
close and become a support if it is coming down and a resistance if it
is going up, and if the reverse happens, then there is the possibility
of the stocks gaining in the opposite direction.
How to make a trendline following the close of the candle
and low stretching of the trendline to the stock.
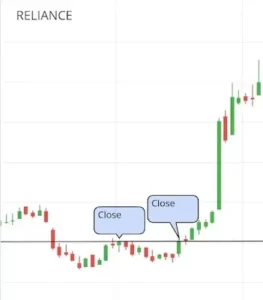 |
| Close to close stretching of trendline |
trendline for the stocks following the close of the candle, just see
that you are attaching the high close to the higher close.
remember is that you should attach the low close to the lower close.
Can a trade be taken only on the basis of the close trendline?
made following the close of the candle of the stocks.
charts, patterns, lines, and indicators, can boost the accuracy of the
trades. Somewhere down the line, it is true, but not wholly. If you
look at only one thing, then you are also going to make a good profit.
Coming down to the question, yes, only a trendline following the close
of the candle can make us profitable.
because if the stock is not going above the close figure, then there
should be
a future prediction of the opening of the candle for the second day if
we are trading the stocks in a day chart.
Open to Open stretching of trendline
rarely used in trading. There are two ways of looking at this, and they
are:
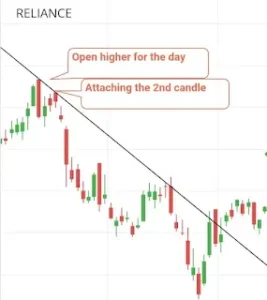
- open higher to high: it simply means that we are going to stretch the
line on the bearish candle because if the open is higher than close,
then it simply means that the candle is a red or bearish candle.
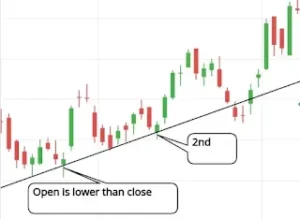
Higher to high open trendline - open lower to low: simply by stretching the line from the lower to the
low of the candle, this is probably going to be the bullish candle
because if the open is lower than the close, then the candle is
bullish and ends in closing green at the close of the trading
session.
Lower to low open trendline
higher, low to lower, close to close, and open to open.
has been discussed here, as have the ways in which trendlines can be
stretched.
Types of Trendlines
- one-side trendline: which is basically stretched on the one
side of the chart or the stocks of the market on which we are applying
the trendline. and - two-sided trendline: this is basically known as the parallel
trendline, which is stretched on both sides of the candlestick,
following the low to high, open to close, or both.
remember in the trading atmosphere because they are not randomly
happening; there is some importance in their happening, and if we perceive
correctly all that, then trading would be profitable and less loss could
happen.
Where do we get the trendline option in the chart?
- Login to your trading-associated account.
- Then go to your marketwatch, where you all save your stocks, or just open any candlestick chart.
- If your account is in zerodha, then as soon as you open your chart, you will see a pencil icon written as Draw. Click on it.
- Then select tools and select lines.
- Go to lines and select the line (this is the tool with which we are going to use it as a trendline).
Live example on Trendline
Verdict: downside or bearish.
Why have we stretched the two-sided trendline here and not in the other stocks?
What we have learned from the live example above is:
- Trendlines can be wrong if they break on one side and instantly break on the other side. Basically, it is not wrong; actually, we have to be with the trend, that’s all.
- After the candle breaks on any side of the trendline, it may take time to react on the side on which it is breaking.
- Lastly, the trendline can react perfectly as per our study.
pros and cons of trendlines
- Trends can easily be predicted, as they help find the trend of the stock.
- It is time-consuming as the trendline changes with time, so to check the perfect trendline, it takes time.
Last thought on trendline
FAQs on Trendlines
- Does the trendline represent all we need to trade?
- No, there are many other factors we need to know before trading. The trendline is one factor that should be important to follow to take any trade.
- How accurate is the trendline?
- Well, it depends on your perfection in how you use it. There are certain cases where the trendline does not work at all; for example, when the trendline is saying something but at the same time certain opposite news comes for the stock, hence rejecting the trendline.
- Does the trendline represent all we need to trade?


