Bharti Airtel Ltd. is in the telecom sector and is included in the telecommunication industry (service provider).
The open price on 29 November 2024 was 1551.15, the high was 1648.90, the low was 1551.15, and the close was 1627.15.
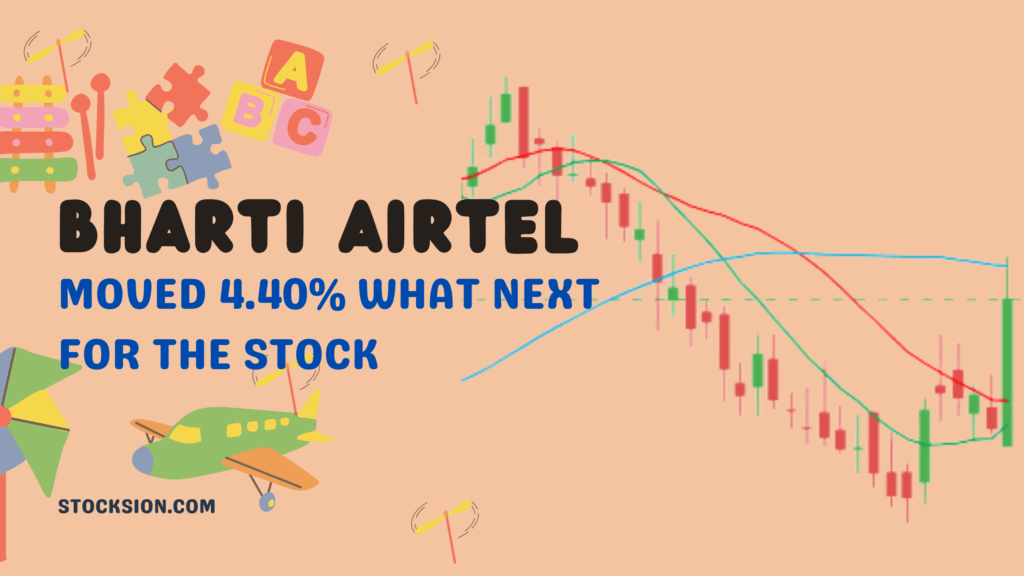
It was one of the best rallies the stock has shown this year. The stock never broke the open price made on 29 November 2024, and the low and open prices are equal, indicating strong bullishness in the stock.
The standalone Basic EPS is 8.74, EBIT is 7224, and the quarterly September 2024 net profit is 2517. ROE (return on net worth or equity) is 4.94 in the standalone figure and 7.39 in the consolidated figure.
Technical analysis of Bharti Airtel Ltd.
We know that Bharti Airtel is one of the best stocks, with fundamentally solid figures that can entice anyone, so let’s see what the technical analysis says about it.
The moving average of Bharti Airtel
The chart shows that the 50-day SMA is at the top of the 21-day SMA and 10-day SMA, respectively, which doesn’t indicate a better picture of the moving average indicator on the Bharti Airtel chart.
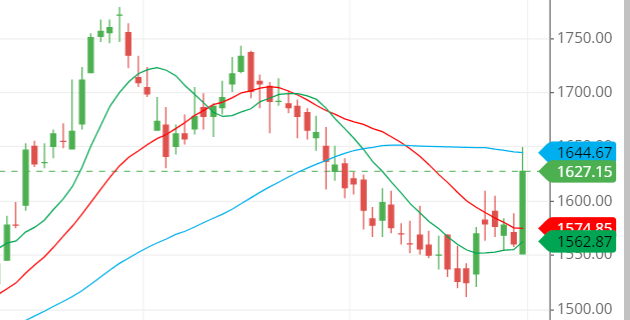
The candle on 29 November 2024 closed above the 21-day and 10-day SMAs, but it fell down after hitting the 50-day SMA, which means it was getting resistance at the 50-day SMA.
It could be a good picture if the stock closes above the 50-day SMA but falls, and the lines of moving averages are not in the correct order as the moving averages lines are in reverse order, which doesn’t make good sense to judge a stock going upside down.
RSI of Bharti Airtel
The RSI stands at around 58, which is a good sign for the RSI to make strong movement at upside movement.
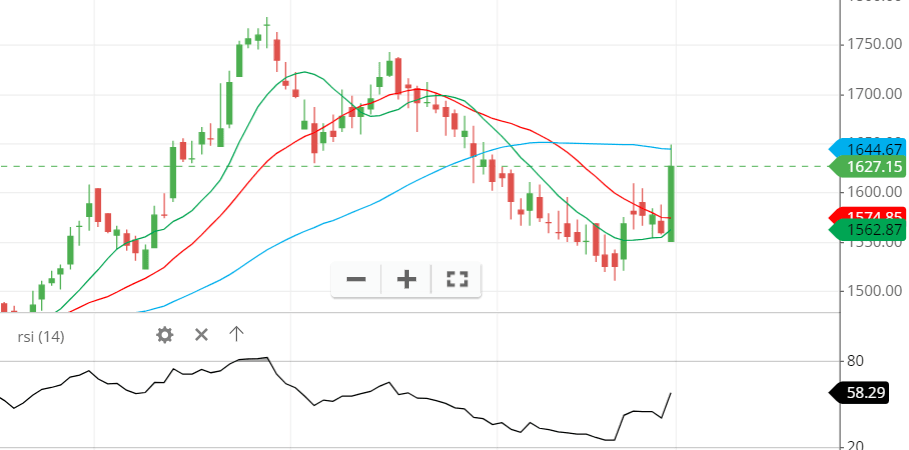
The RSI is at the middle level, indicating that the stock might go on either side.
But if we compare the moving average with the RSI, they disagree, as the moving average is not that interested in going upside, but the RSI is showing interest in going upside. If we recommend the moving average, then the RSI may go down.
Candlestick and chart pattern of Bharti Airtel
The candlestick is a strong, bullish candle that covers almost 95 points and closes at around 67 points, denoting the heavy buying pressure in the stock on 29 November 2024.
The closing almost above the high of the previous 17 candles shows how much the stock went on 29 November 2024.
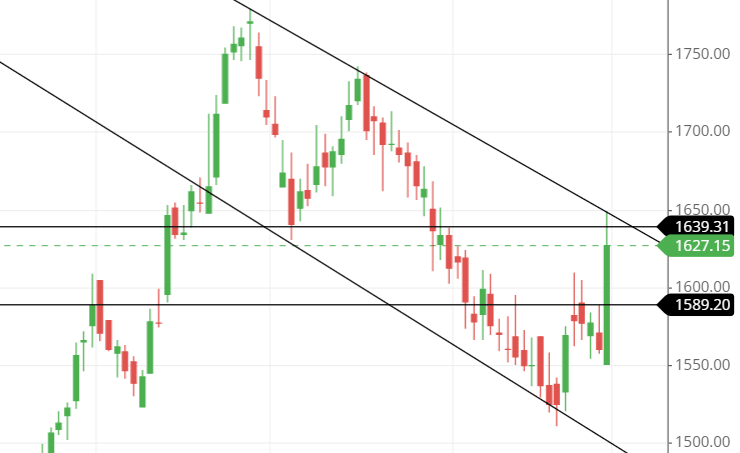
The chart pattern or candlestick pattern seems to be a MAT HOLD PATTERN, where the first candle is large, the second is a gap-up higher candle, and the other three remain to move on the downside. The fifth candle is again a big candle, indicating a continuation of the buyers’ trend.
Analyze the chart pattern shown below. It will tell you that the stock can move down as it works in a downside channel. After hitting the upside trendline and the resistance at the level around 1640, the stock is likely to come down to touch the price at 1590.
Last thought on Bharti Airtel
As the indicators and the trendline show, the stock seems uninterested in taking an upside movement.
But remember that the stock has a solid fundamental figure that should not worry anyone for long-term investment.

