BIOCON shares fall under the Healthcare sectors and are included in the Biotechnology & Medical Research industries.
BIOCON mainly works in manufacturing biotechnological products enticing to the healthcare field.

As of September 2024, the public holding for BIOCON shares remains at 18.74%; the promoter has 60.64%.
Please note that FII (Foreign Institutional Investors) has a 5.93% shareholding, and DII (Domestic Institutional Investors) has a 14.44% shareholding. In contrast, others have a 0.25% percentage shareholding.
It is one of the best stocks in the market, with a diverse shareholding pattern meant to be good in the sense of diversity.
Some of the crucial standalone figures as of the year 2024 are:
- Earnings per share (EPS) remains at 1; in 2023, it was 23.87.
- ROE is 1.09, and in 2023 it was 26.09.
- Total income is 2320 cr. With EBIT remaining at 349 cr.
- Total expenditure is 1971 cr., and the net profit remains 119 cr.
- Reserves and surplus are 10312.
- Net cash flow is -74.
The price for the BIOCON share as of 7th January 2025
Open – 363.10, High – 387.60, Low – 363.10 and close – 385.90.
The open and low of the stock price today are the same, which indicates bullish pressure in the stock right now. On the other hand, the stock gaped up almost 30 points, which is also a sign of bullishness in the stock.
Technical analysis
Let’s analyze some of the stock’s technical figures to determine better the stock flow on which side it is redeemed.
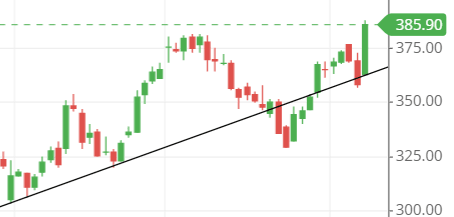
What is the trend of BIOCON share according to the trendline?
The chart shows that the stock’s present trend is an uptrend. The stock is moving to the upside as the flow of the made trendline is from down to up, which suggests that the stock is going upside, and any trading commencing on the upside would be a better choice.
BIOCON. shares SMA (simple moving average) lines.
Blue line – 50-day SMA; Red line – 21-day SMA; Green line – 10-day SMA.
The green line is above the two other lines of SMA, which indicates that the stock is in a bullish face and the stock price is too above the three SMA (simple moving average) lines, which makes a positive attitude towards the uptrend movement.
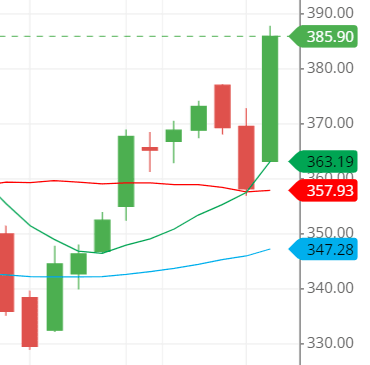
The crossover of the green and red or 10-day SMA line crossed the 21-day SMA line indicates that the stock will likely go upside down, making a strong bullish trend.
Many traders like to take trades based on the crossover, and if you are one of those, you can do that with a stop loss and a trailing target.
Support & resistance of BIOCON share
The stock is trying to close above the resistance, which it recently broke, around level 380. The stock could reach new highs if it successfully closes above the resistance.
However, if the stock remains below the resistance level of 380, it could make support-level figures.
So, now, the stock closing levels are significant, and level 380 is fundamental as it will determine whether the stock will rise or fall.
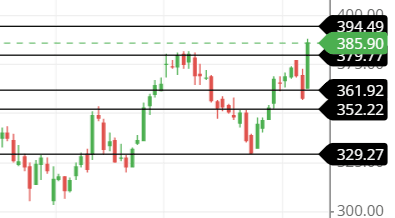
The three possible support and resistance levels are:
Support – 380, 360 and 352.
Resistance – 392, 422, and 444.
Chart & candlestick patterns of BIOCON share
Candlestick pattern: The stock is preparing to make a bullish engulfing pattern, as yesterday’s close was a bearish candle. Today, the stock is trying to close above yesterday’s high. It seems that the stock might be closing above yesterday’s high quickly as it is far off yesterday’s high.
Chart pattern: The stock seems to be in an uptrend rising channel, growing at every level, making new highs and higher lows at every rise.
Overall, the stock is somewhat making a bullish rising pattern.
Last thought on BIOCON Share
The stock seems excellent from the perspective of buying it for short-term trading with a cautious stop loss and target.
The stock SMA and support and resistance lines portray positive sentiments toward buying.

