DMART shares fall under the retailing sectors and are included in the retailing industries.
DMART (Avenue Supermarts Ltd.) mainly manufactures food, garments, beauty products, and other similar products.

As of September 2024, the public holding for DMART shares remains at 7.91%; the promoter has 74.65%.
Please note that FII (Foreign Institutional Investors) has a 9.95% shareholding, and DII (Domestic Institutional Investors) has a 7.5% shareholding. In contrast, others have a 0% percentage shareholding, while till June 2024, it is 0.02%
It is one of the companies with a massive promoter shareholding pattern, which consumes almost 3/4th of the pattern weightage.
Some of the crucial standalone figures as of the year 2024 are:
- Earnings per share (EPS) remains at 41.43; in 2023, it was 39.46.
- ROE is 13.97, and in 2023 it was 15.49.
- Total income is 49722 cr. With EBIT remaining at 3655 cr.
- Total expenditure is 46066 cr., and the net profit remains 2694 cr.
- Reserves and surplus are 18629.
- Net cash flow is 72.
The price for the DMART share as of 3rd January 2025
Open – 3840, High – 4165.90, Low – 3820, and close – 4088.75.
As the market is open right now, the prices may vary.
Technical analysis
Let us analyze some of the stock’s technical figures. After getting the fundamental statistics, the stock seems to have something to do with this year.
Let us check whether the technical figures compile with it or not.
What is the trend of DMART share according to the trendline?
Do you know that knowing about the trend almost does everything we need to analyze the technical aspects of the stock chart?
If we know the trend, we can be on the right path.

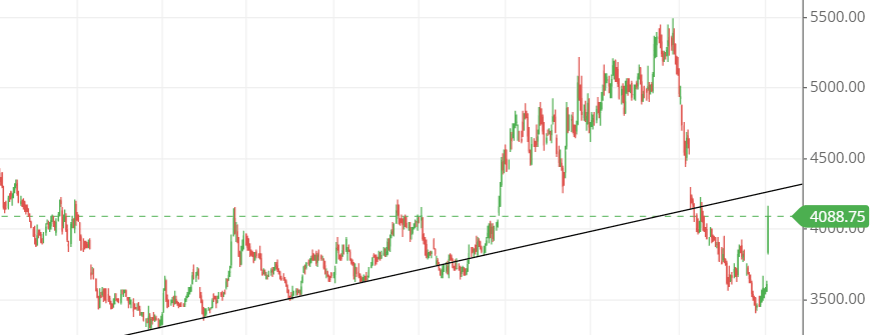
The chart shows that the stock is downtrend, as the price is below the stretched trendline.
Buying should always be avoided until a trendline is seen in the chart to grow with the stock price.
DMART shares SMA (simple moving average) lines.
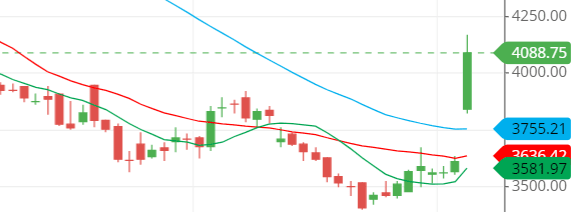
Blue line – 50-day SMA; Red line – 21-day SMA; Green line – 10-day SMA.
The structure of the moving average line is in reciprocal order, which means that the 50-day SMA is at the top, the 21-day SMA is in the middle, and the 10-day SMA remains at the bottom.

However, it is an indication of the bearish movement in the stock.
But what is exciting is that the stock price is above the three SMA (simple moving average) lines, which means that the stock will likely come down or the moving average line will change its structure, insinuating a bullish movement in the stock.
Currently, the stock should be judged for the moment to let him better its moving average line.
Support & resistance of DMART share
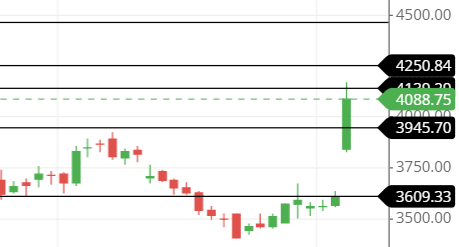
The stock has touched its resistance at around price level 4150, and after touching it, it seems to be coming down to touch its nearest support level, around 4000.
If the stock closes below 3890, it is assumed that it might fall to touch the support level, around 3600. If this happens, almost 300 points can be broken down.

The three possible support and resistance levels are:
Support – 3944, 3750, and 3600.
Resistance – 4125, 4250, and 4444.
Chart & candlestick patterns of DMART share
Candlestick pattern: The candlestick seems to be a large bullish candle, similar to the bullish Marubozu candlestick pattern.
Chart pattern: The chart pattern seems bearish, with the price continuously falling and surging a little after touching the previous support level zone.
Last thought on DMART Share
The stock is rising now, but it is in a downtrend, and any buying activity could cause us to pay more than our target.
It’s better to observe the stock’s action now for a moment and look for a buying opportunity when it comes above the trendline, as shown in the chart above.


