EMSLIMITED shares fall under the Capital goods sector and are included in the Engineering–construction industries.
EMSLIMITED mainly works in Engineering and construction activities, which include sewage treatment plants, water treatment plants, etc.

As of September 2024, the public holding for EMSLIMITED shares remains at 28.46%; the promoter has the most significant share, 69.70%.
Please note that FII (Foreign Institutional Investors) has a 0.75% shareholding, DII (Domestic Institutional Investors) has a 1.08% shareholding, and others have 0.01%.
As the stock is new and listed on 21 September 2023, the fundamental figures seem fresh and energetic, suggesting an upward trend.
Some of the crucial standalone figures as of the year 2024 are:
- Earnings per share (EPS) remains at 28.91; in 2023, it was 21.95.
- ROE is 19.10, and in 2023 it was 21.50.
- Total income is 734 cr. With EBIT remaining at 204 cr.
- Total expenditure is 529 cr., and the net profit remains 149 cr.
- Reserves and surplus are 729.
- Net cash flow is 14.
The price for the EMSLIMITED shares as of 26th December 2024
Open – 918.45, High – 918.45, Low – 861.25, and close – 867.
The prices may vary as the market is open right now.
Technical analysis
After a tremendous figure of the company, let us now evaluate some of its technical figures by analyzing the stock chart.
What is the trend of EMSLIMITED share according to the trendline?
When the stock was listed on the market, its opening price was 282.05. It made an all-time low at around 250, and from there, it touched the price level of 1000, making it a 4x profit.
But as the trendline suggests, the stock is going upside, and there has been a 5% fall today, as we can see in the chart.
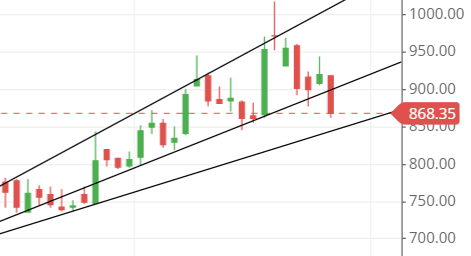
The stock cuts the previous trendline and is coming down to touch the bottom trendline, but the trendline’s flow is upside down, and there is a chance that the stock might go up after touching the bottom trendline.
So, as of now, the trend is uptrend.
EMSLIMITED shares SMA (simple moving average) lines.
Blue line – 50-day SMA; Red line – 21-day SMA; Green line – 10-day SMA.
The moving average lines also show in the chart that the stock has an uptrend and is flowing from down to up to make the stock move at an uptrend movement without any hindrance.
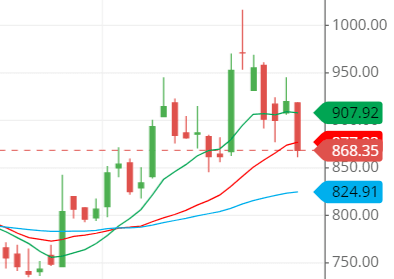
The stock price level is now below the 21-day SMA (simple moving average) line, indicating that it might be touching the bottom SMA line, which is the 50-day SMA line.
The price level and the SMA line are not synchronized well, so the stock might be confused about where to go.
If we have to make any decision, then we are surely going to observe the stock for the time being and then take any decision after the stock gets above the 10-day SMA line.
Support & resistance of EMSLIMITED share
The support and resistance lines are too close, causing some confusion. The lines are also too near to tell which side to go, making it difficult to judge.
But predicting this kind of support and resistance becomes easier if we follow it with a trendline. The trendline suggests that the stock might be touching the bottom first, and then it will react to some other line.
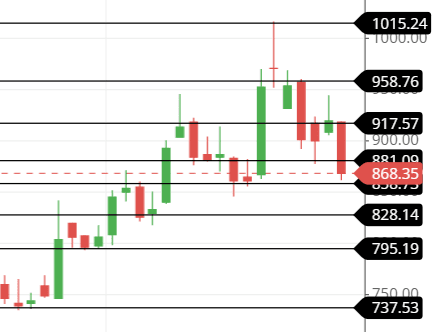
The three possible support and resistance levels are:
Support – 860, 830 and 801.
Resistance – 881, 915, and 955.
Chart & candlestick patterns of EMSLIMITED share
Candlestick pattern: The combination of today and the previous candle makes a bearish engulfing candlestick pattern, which indicates strong bearish pressure in the market. The stock price is going down for now.
Chart pattern—it is not confirmed, but it seems the stock is trying to make a head-and-shoulder pattern, and when the neckline breaks, the stock price goes down too far.
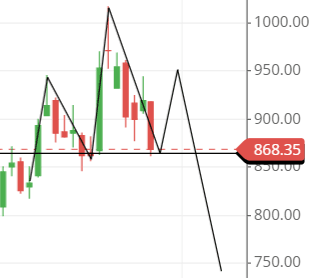
Last thought on EMSLIMITED Share
Selling pressure exists in the stock right now, and looking for an opportunity to go long would not be a good idea. Rather, we should wait for some time to help the stock make a good pattern and structure before considering going long on it.
Currently, selling would be a better choice with good stop loss and target Made at a good level.

