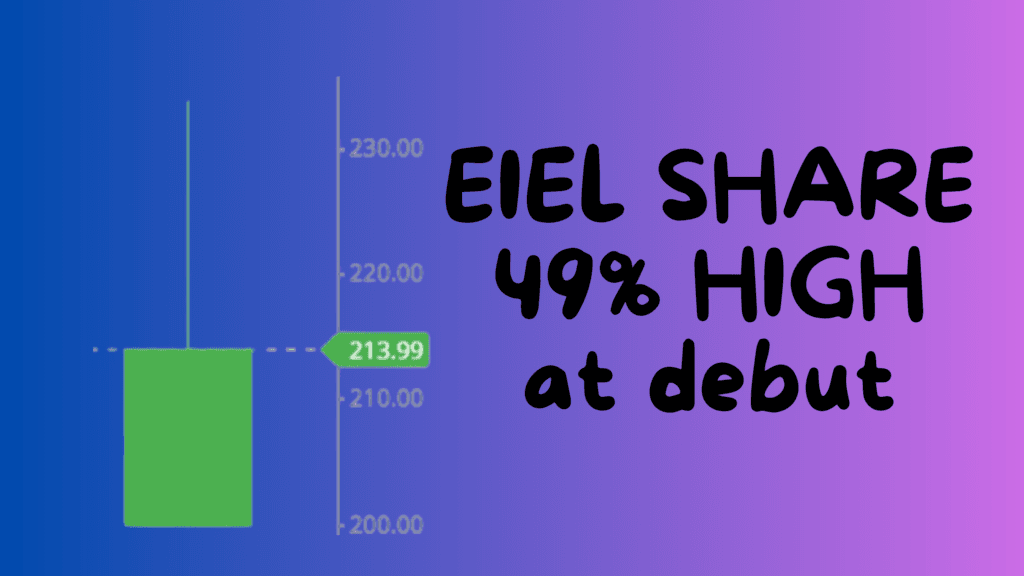
Enviro Infra Engineers Ltd. (EIEL) got listed on the stock market today, 29th November 2024, and it boomed immediately after being listed for traders.
Enviro Infra Engineers Ltd is a company that is usually involved in wastewater and water problem-solving scheme projects.

EIEL comes under the capital goods sector and is included in the Engineering – Industrial Equipment Industry.
The open price for the NSE is 220, and for the BSE, it is 218. However, the chart may show a different value because of the stock’s newness and technical accumulation, which is quite normal.
The exciting part for the stock is that the premium it had allocated for the IPO ranged between Rs 140-148, which has given them an increment in return of +48.64% in NSE and +47.29% in BSE over the premium price.
Technical analysis of Enviro Infra Engineers Ltd. (EIEL)
Before going to understand the Technical aspects of EIEL, we should at least know that the total liabilities for March 2024 are 705cr, EBIT is 171cr, net profit is 114cr, and basic EPS is 8.37. Remember that these are all standalone figures.
So, let us begin our technical analysis to better understand the stock.
Moving average
There is not much to say about the stock’s moving average, as the stock is newly debuted in the market today, but as the candle moved above just after it got listed and seems to be closing above the open price, it can be said that the chances of it breaking the moving average of any day would be possible in the coming days.

So, a positive markup can be done on the basis of the moving average. Yeah, from the listed price, which was earlier in a range of Rs 140-148, and now on the chart, we can see that the price got higher on the day of opening. From this, too, we can assume that the moving average can be good after a few days of trading.
What can be assumed by a newly made candlestick?
The candle seems to be an inverted hammer candlestick, which can be assumed to indicate a bullish trend in the market in the coming days.
The low price seen in the chart is equal to the open price, which is more a kind of pressure built by the buyers in the present. It can be difficult for the sellers to beat them when bulls prevail over the bears.
One depressing fact is that the chart’s high at price 233.7, followed by a fall of less than 20 points to around price 213, can slow the upside movement.
But if the stock breaks the high made by the stock at a price of 233.7 on the second-day candle, then the upside movement could be fast.
Last thought
The stock is new, and just judging one candle cannot give a proper technical idea of it. But if we read the fundamentals, we will realize that the stock is worth something, as water exists daily and has too many problems, and water treatment would cost us shortly.


