Do you want to know what will happen to GKW shares after a disheartening fall?
Then, be with us and try to study the technical analysis we will be doing here.
GKW share has seen a price drop of almost 1400 and has reached a price level of around 2700.
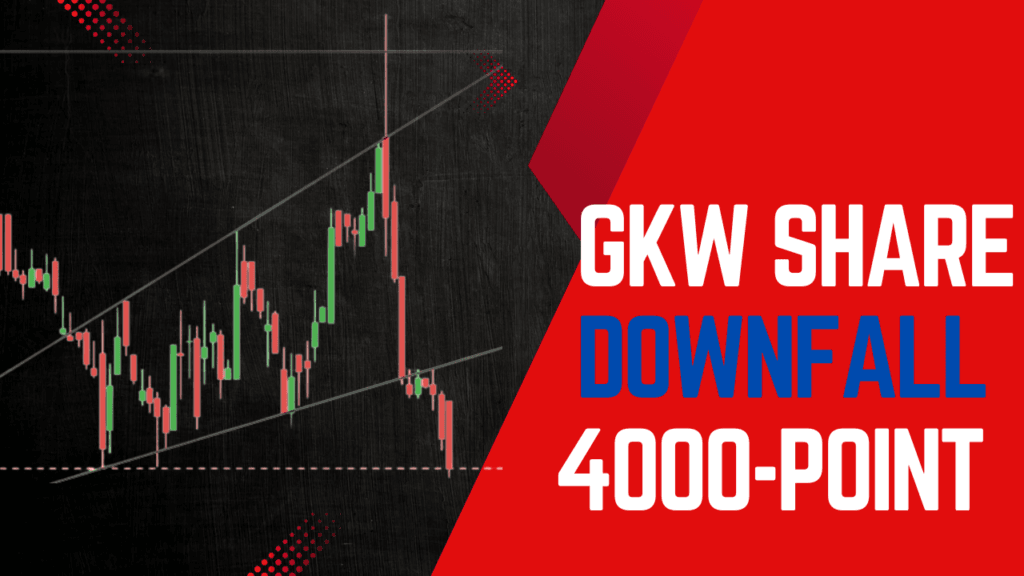
From the long-term perspective, the share has been in an uptrend but recently the share came down with huge velocity.
The market is discussing whether one should stay with the stock or come out as fast as possible, but let me tell you that no decision should be made in haste without proper speculation.
Let us try to understand what the technical figures are of GKW share
Technical Analyze
Technical analysis is solely based on chart reading, so we will try to take our decision-making strategy wholly based on reading the chart.
What does the moving average of GKW share tell us?
If you look at the chart, you will see that the candlesticks are far down from the moving average.
The moving average of 50 days, 21 days, and 10 days are above the price of GKW shares.
If we look at the strategy of moving average crossover, we will find that the moving average of 21 days recently crossed with the moving average of 10 days.

So, the moving average crossover displays a good chance of going to the downside movement of the stock. So, if someone tries to go on the sell side then it might be a good chance based on what the crossover says.
For the traders: The chart based on the moving average is not good for going for uptrend movement, so it is brave to be out of it until a good possible chance comes in the stock.
For an investor, when one is with the stock for a long-term view, it should not bother anybody because the market works like this: It will go up for a moment and come down, and then again, it will repeat the same process from time to time.
Final verdict : after analysing the moving average: No upward movement should be predicted; stock will go downside.
What does the chart pattern of GKW share tell us?
The chart pattern of GKW Share tells us many things and we have to be very patient to listen to that saying with ease without making our chart complicated with too many Indicators.
The chart shows that after being in a range for some time the stock now breaks down at around price 3000.
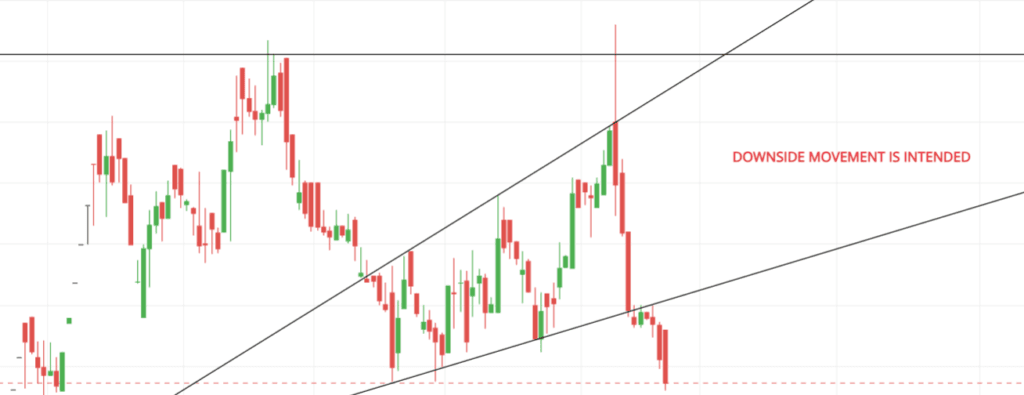
The chart now seems to make a downside pattern encouraging more bearish candidates to take part in selling pressure.
On the other hand, it may also make the same pattern that it made before the breakdown happens, but it is a possibility, not a surety but we have to keep it in mind for further analysis.
Final verdict : Final verdict: downside movement is expected
What is the support and resistance for the GKW share?
Support and resistance are the most important thing to look out for, if we are analyzing the technical of any stock.
The chart of GKW shares shows that it came down after hitting the previous high of 4085.25 prices, which was made by the stock on August 21st, 2024, in other words, it was a strong resistance that the stock faced.
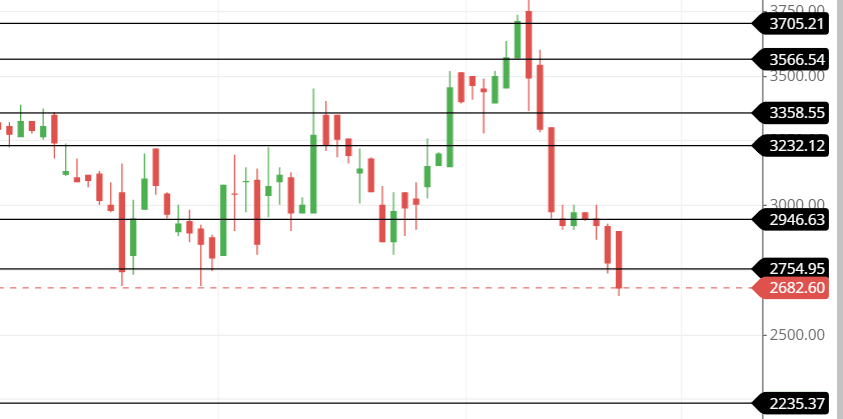
As for now, the stock is likely to go down to its next support level which is around 2250 level.
But if the stock tries to move upside then possible resistance of level which is around 2750, 2940, 3220 can be seen.
Look at the chart below to get a better idea of the stock support and resistance.
Final verdict : the stock is going to touch the support level next
How the candlestick structure is in the presence of GKW share.
Now at present, the bearish candles are in huge amounts, big huge candles usually represent the bearishness in the market.
We can see in the chart that the top of many bearish candles has small wicks denoting the heavy seller pressure prevailing in the market.
On 12th November, we can see that a candle like Marubozu existing in the chart, represents the heavy selling pressure in the market, and entering the present time right now is not a good idea for trading or investing.
On the 7th and 8th of November, we can see that the bearish engulfing pattern happened which means the market will continue to be in a bearish trend for the time being until anything happens that will reverse the market trend in bullishness.
There are also candle patterns similar to three black crows which on the other hand represent the upcoming bearishness in the stock.
Observing the market is the best study for analyzing any chart technical.
Final verdict : A bearish candle is heavy and signifies downside movement
What is the indication of RSI for the GKW share?
Right now, the RSI is around 33 which is a nice chance for buying the stock for the long-term perspective because, around a level of 30 or 20 RSI, the price is low of the stock are a better price is expected if the stock moves from here to 60 or around 80 of the RSI.
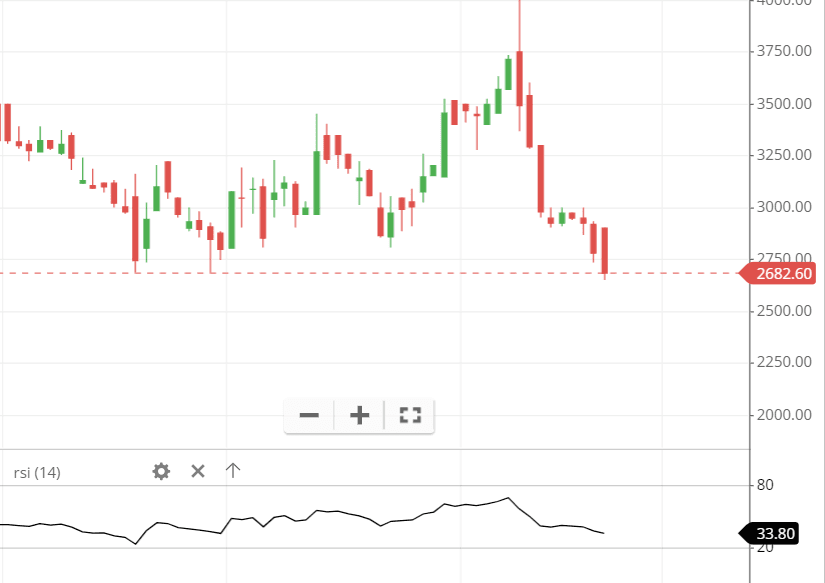
Usually, the divergence of RSI is looked for but the divergence is not occurring right now, if we want to trade the divergence then it is better to look for the time when it is happening in the stock and then enter.
If we stretch the horizontal line in the RSI of the GKW share then we will find that the RSI had strong support at level 40 and now when the support level is brock a possible resistance can be seen at level 40, telling us not to take trade for long side right now.
Final verdict : RSI is weak, and selling pressure exists right now.
Final thoughts after analyzing the GKW share Technical.
After analyzing the Technical of GKW share, we came to the conclusion that the stock is right now facing heavy selling pressure in the market and buying would not be a good idea right now.
But even if buying commenced then it is better that we come out of the stock as fast we get the good opportunity or near the first resistance level, but if someone is targeting for long-term then they needn’t be worried as the long-term doesn’t need any technical analyzation, it is sheerly based on the fundamental of the stock.

