GSFC shares fall under the chemicals sector and are included in the fertilizer industry.
GSFC (Gujrat State Fertilizers and Chemicals Ltd.) mainly manufactures fertilizers and industrial products.

As of September 2024, the public holding for GSFC shares remains at 38.63%; the promoter has 37.84%.
Please note that FII (Foreign Institutional Investors) has an 11.81% shareholding, and DII (Domestic Institutional Investors) has an 11.71% shareholding. In contrast, others have a 0.01% shareholding.
The company has a good diversified shareholding pattern.
Some of the crucial standalone figures as of the year 2024 are:
- Earnings per share (EPS) remains at 13.16; in 2023, it was 32.45.
- ROE is 4.15, and in 2023 it was 10.8.
- Total income is 9308 cr. With EBIT remaining at 675 cr.
- Total expenditure is 8632 cr., and the net profit remains 524 cr.
- Reserves and surplus are 12531.
- Net cash flow is -570.
The price for the GSFC share as of 18th January 2025
Open – 194.90, High – 212.70, Low – 193.20 and close – 208.86.
Technical analysis
After obtaining some of the fundamental data figures, let us analyze some of the technical figures to get a better idea of the stock.
What is the trend of GSFC share according to the trendline?
The present trend of the GSFC share is a downtrend, as the stock fell after touching the level of around 320.
The stock is now consolidating at a downtrend.
It showed a slight hike in the price, but the downtrend suggests that it could be staying down for the moment, as the chart indicates.
GSFC shares SMA (simple moving average) lines.
Blue line – 50-day SMA; Red line – 21-day SMA; Green line – 10-day SMA.
The SMA (simple moving average) line indicates the stock is downtrend. The three lines are reciprocal; the 50-day SMA line should be at the bottom. However, the line in this chart is above, indicating a downtrend.
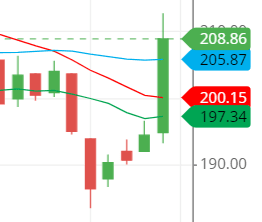
The price is above the three lines, which is a bullish sign, but the structure will not make it happen unless it changes.
Support & resistance of GSFC share
The support and resistance lines of the stock give confidence, as we can see in the chart that the stock has been breaking the resistance continuously for the past three candles, which is a good sign to invest in the stock for a shorter period of time.
As of now, the stock is looking to touch its nearest resistance line, which is around level 215. If it crosses above it, then the possible level of 220 can be seen.
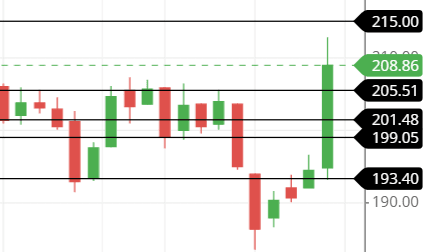
The three possible support and resistance levels are:
Support – 205.50, 201 and 195.
Resistance – 215, 220 and 230.
Chart & candlestick patterns of GSFC share
Candlestick pattern: The stock made a bullish, engulfing candlestick pattern on January 15th and 16th, 2025, which is a strong indication of its uptrend.
The chart shows that the stock moved well afterward, from 195 points to 210 points on 17 January 2025.
Chart pattern: The chart pattern suggests that the stock is in a bearish trend. A little surge up has been seen in the stock for a while, and if it sustains, then the stock can possibly rise.
Last thought on GSFC Share
The stock is in a downtrend, and any decision taken on the upside should be consciously made with a strict stop loss and a target that should be less. Let’s say the stop loss is 5 points, and then the target should comply with the same.

