HAL shares fall under the aviation sector and are included in the aerospace and defence industries.
HAL stands for Hindustan Aeronautics limited.

The company’s primary work is to manufacture and service aircraft and helicopters across the globe.
As of September 2024, the public holding for HAL shares remains at 8.13%; the promoter has the most significant share, 71.64%.
Please note that DII (Domestic Institutional Investors)has an 8.37% shareholding, and FII (Foreign Institutional Investors) has an 11.85% shareholding.
Some of the crucial standalone figures as of the year 2024 are:
- Earning per share (EPS) remains at 113.57; in 2023, it was 173.79.
- ROE is 26.14, and in 2023 it was 24.72.
- Total income is 32279 cr. With EBIT remaining at 10231 cr.
- Total expenditure is 22048 cr., and the net profit remains 7595 cr.
- Reserves and surplus are 28712 cr.
- Net cash flow is -184.
The company’s standalone figures are decent to invest in a long-term perspective.
The price for the HAL shares as of 13th December 2024 is as follows:
Open – 4736.75, High – 4755, Low – 4660.55 and close – 4696.6.
As the market is open now, the prices may differ after closing.
Technical analysis
After reading some of the important figures of the company fundamentals, we conclude that the company has a good, diverse shareholding portfolio and decent outgoing profit figures for the year 2024.
Let us now acknowledge some of the essential technical figures by reading the chart of the HAL share.
What is the trend of HAL share according to the trendline?
After the stock’s downfall in July 2024, it has now reached the trendline, which indicates that it is upgoing in a bullish trend.
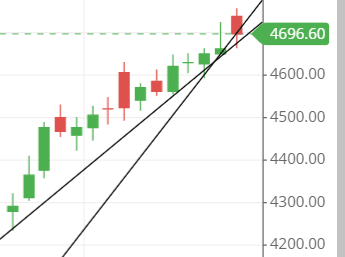
The trendline is going from down to up, which indicates that the stock will move upside. Unless any strong changes are seen in the chart, this could be a short-term trend.
HAL shares SMA (simple moving average) lines.
The moving average also gives a good signal for being bullish in the stock.
The price level is above the three SMA (simple moving average) lines, which signifies the stock’s bullish trend.
The three lines, which are blue (50-day SMA), red (21-day SMA), and green (10-day SMA), are all in ascending order, which means that the moving average lines are helping the stock to move upside.

But as you can see, the green line is far above the other two lines, which means that the stock could be coming down to check the other line on the downside.
So, the SMA line shown in the chart has a mixed opinion, which means that it can move either way.
Support & resistance of HAL share
The chart suggests the stock is resting on the support line and could go upside down to touch the nearest resistance line, around 4850.
But as we have analysed the moving average above, if we mix up the moving average and the support and resistance figures together, then it can be defined that the stock might come down to touch the support line and the moving average line at the bottom, which is the 21-day SMA.
The moving average line is creating pressure on the stock to fall to touch the support line, which is around 4600.
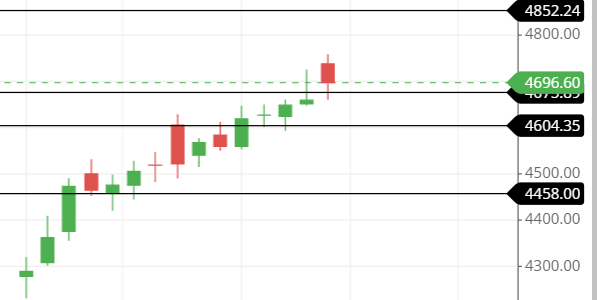
The three support and resistance lines are:
Support – 4675, 4601 and 4500.
Resistance – 4850, 4950 and 5000
Chart & candlestick patterns of HAL share
Candlestick pattern — For the past few days, the stock has been making the hammer kind of candle in the chart, and yesterday, on 12th December 2024, the stock made an inverted hammer kind of candle.
Chart pattern—An ascending bullish chart pattern is made in the chart, which indicates a strong upside movement in the stock.
Last thought on HAL share
The moving average lines are interesting, whereas the support and resistance are too good for deciding to go long.
Candlestick and chart patterns are making the stock move towards the upside direction on a whole. If we decide to go long for the stock, then it is fine as no hitches are seen in the chart, but the target should be set with good stoploss.

