HEG shares fall under the capital goods sector and are included in the electrodes and electrical equipment industry.
As of September 2024, the public holding for HEG (Hindustan Electro-Graphite’s Ltd) ‘s share remains at 24.49 %, while in June 2024, it was 25.06%, more significant than the present month of September 2024. The promoter has the most significant percentage of share, which is 55.78% as of September 2024.

Some of the crucial standalone figures as of the year 2024 are:
- Earning per share (EPS) remains at 59.99
- ROE is 5.58
- Total income is 2536cr. With EBIT remaining at 350cr.
- Total expenditure is 2185cr and the net profit remains at 231cr.
- Reserves and surplus are 4106cr.
- Net cash flow is 85.
The price for the HEG share on 4th December 2024 is as follows:
Low – 500.50, open – 505.10. High and close can vary as the market is not closed yet, but as of present, the HIGH is at 569.45, and the close, as shown in the chart, is at 563.95.
Technical analysis
Our technical analysis will be based on three things: support and resistance, chart and candlestick patterns, and one indicator, the SMA (simple moving average).
Support and resistance of HEG share
Let us first understand what the stock is telling about the support and resistance of the stock.
From the chart, we can understand that the stock is in a bullish face. Buyers are too heavy on the seller and keep moving the stock to a different level of expectation.

Currently, the resistance levels are broken, and the stock is rallying to break the next resistance level, whichever is nearest. In a situation like this, the buyers are heavy, and resistance levels are not too strong to stop them, as this is one of the psychology that runs the market like this.
The next three support and resistance levels are:
Resistance levels: 573, 694, and 722
Support levels: 538, 502 and 477
Chart & candlestick pattern of HEG share
Here, we can see that the chart is making a falling wedge pattern.
Well, in a falling wedge chart pattern the stock moves down after a high and consolidate until the sellers losses their momentum and buyers comes in to break the trendline to make a new high or they just break the trendline to establish a new momentum in the stock.

The candlestick pattern made by the stock on 2nd and 3rd December 2024 was bullish engulfing pattern and today on 4th December 2024 the candle seems to be Marubozu candle indicating a strong bullishness in the stock for the time being.
HEG share SMA (simple moving average) lines
The three lines as indicated in the chart are:
Blue line indicates 50 days SMA.
Green line indicates 10 days SMA.
Red line indicates 21 days SMA.

From the chart we can understand that the SMA lines are not according to their timing as after 50 days SMA 21 days SMA should be the next but 10 days SMA was after it which informs us that the moving average lines are not accurate to encourage anybody to go for buying side.
On the other hand we can see in the chart that the stock price are above the SMA lines indicating a strong bullishness prevailing in the stock right now.
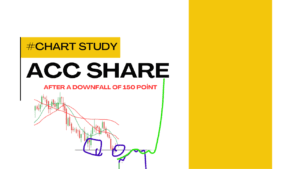
But we should understand that the stock has already provided us with 150-point profit from the previous low made by the stock at level 400.
Last thought
The stock has already made a good amount of rise within these two three days and rising again would not be that much possible as it made on 3rd and 4th December 2024.
But if we are still interested in the stock then going for long term would be better.