HPIL LTD.’s share falls under the chemical and petrochemical sectors and is included in the specialty chemicals industries.
HPIL LTD. (Hindprakash Industries Ltd.) mainly works in the manufacturing and trading of dyes.

As of September 2024, the public holding for HPIL LTD. shares remains at 25.06%; the promoter has 74.95%.
Please note that FII (Foreign Institutional Investors) has a 0% shareholding, and DII (Domestic Institutional Investors) has a 0% shareholding. In contrast, others have a 0% percentage shareholding.
It is one company with no shareholding for FII and DII.
If any stock doesn’t have these shareholdings, it is not meant to be a good long-term investment, but there may be situations when it is the best return for short-term investments.
Some of the crucial standalone figures as of the year 2024 are:
- Earnings per share (EPS) remains at 1.44; in 2023, it was 2.36.
- ROE is 3.05, and in 2023 it was 5.76.
- Total income is 100 cr. With EBIT remaining at four cr.
- Total expenditure is 96 cr., and the net profit remains four cr.
- Reserves and surplus are 38.
- Net cash flow is 0.
The price for the HPIL LTD. share as of 1st January 2025
Open – 140, High – 165.99, Low – 137.01, and close – 162.50.
As the market is open right now, the prices may vary.
Technical analysis
After the not-so-good fundamental figures, let’s examine some of the stock’s technical statistics to understand it better.
What is the trend of HPIL LTD. share according to the trendline?
In the monthly view, the stock is in an uptrend, but if we look at the daily chart, we will realize that it is facing consolidation, as it is constantly flowing within the range of around 150 to 200.
So, if we are aware of the situation, we will take the trade within the said range and make a profit booking as soon as the above range is reached.
HPIL LTD. shares SMA (simple moving average) lines.
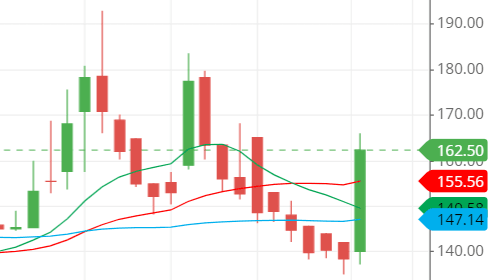
Blue line – 50-day SMA; Red line – 21-day SMA; Green line – 10-day SMA.
The SMA (simple moving average) is inaccurate as the lines are not in position; the 21-day SMA is above the 10-day SMA, whereas the 10-day SMA should be above the 21-day SMA.
On the other hand, the 50-day SMA is below the other two lines, which is good and indicates that the stock might soon move to the upside.

Today’s price closes above the three SMA lines, indicating intense bullish pressure in the stock. As it closes above the three lines, the stock might start a run to the upside.
Support & resistance of HPIL LTD. share
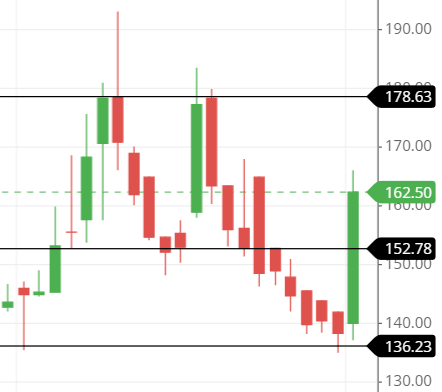
The stock has now crossed the nearest strong resistance line, around 150, and is preparing to touch the second nearest strong resistance line, around 175.

The three possible support and resistance levels are:
Support – 150, 135 and 125.
Resistance – 175, 200, and 225.
Chart & candlestick patterns of HPIL LTD. share
Candlestick pattern: The stock made a bullish engulfing pattern, combining yesterday’s candle, which is a strong signal for the stock to go upside down.
Chart pattern: The stock seems to be in a consolidation phase, working within the range bound.
If it breaks to the upside, the uptrend will start, and if it goes down, the stock can be more bearish than ever.
Last thought on HPIL LTD. Share
I think the stock is working in a range, and working as the chart suggests would be consistent with the trading strategy.
The target of the level of 200 seems possible in a few days.


