Let me say that I am technical, but I am still looking for some fundamental figures to get some insight into the company. I see a chart, and based on that, I decide and follow my study to buy or sell equity.

Do you want to know what happened and how I lost it to learn something from my mistake so that you don’t repeat it as I have done it?
This is a great way to analyse and learn, so without wasting any time, let’s understand what happened and how the stock is reacting now.
When I bought and what happened in IPCALAB
After analysing and finding the better stock for short-term trading, I bought it on January 3rd, 2025.
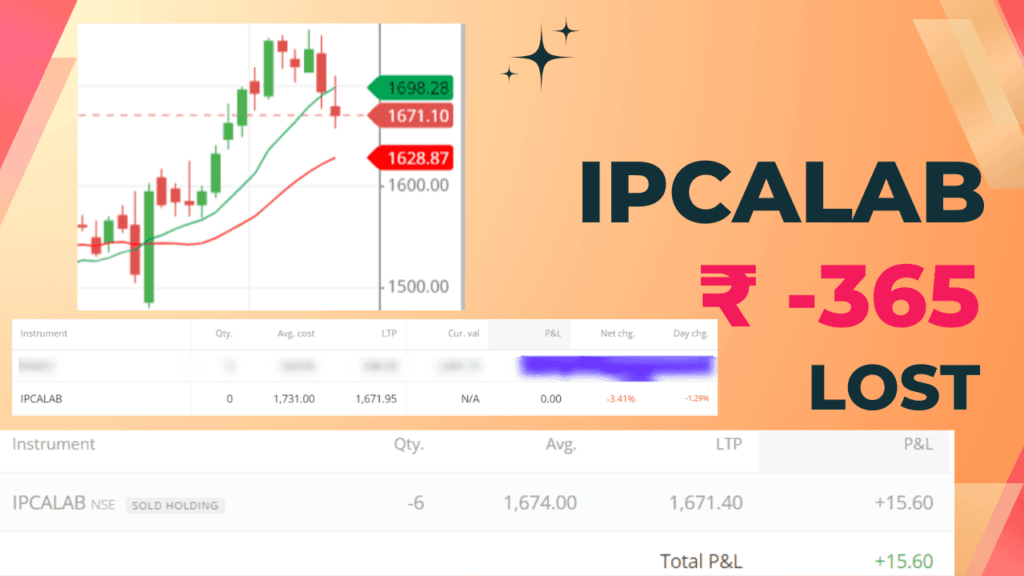
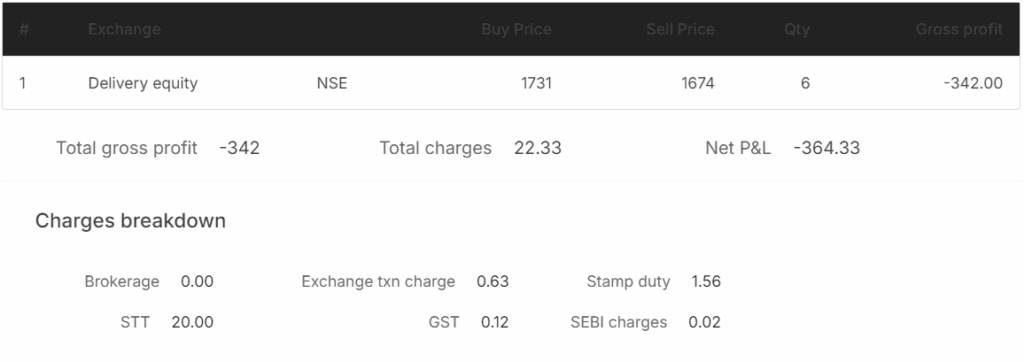
Let me clarify that I bought it after averaging it. The average, which came out, was ₹ 1731, and I made a stop-loss GTT trigger at ₹ 1674.

So if any problem exists or my analysis fails, the stop loss will hit, and I will suffer less harm.
And today, on 9th January 2025, my stoploss got it, and I have to face the loss of ₹ 365.

The loss was not hurting much because my analysis failed, and that stung me from the inside.
What I saw in Fundamental of IPCALAB
First, I saw that the IPCALAB share is in the Healthcare sector, which is the pharmaceutical and drug Industry.
Then I went on to see the shareholding pattern, and I found a decent shareholding structure with decent diversified pattern structures for the DII, FII, PUBLIC, and PROMOTER. This makes me feel good about the company’s mindset and working procedure.
EPS was decent, at 26.16, and ROE was too enticing, at 8.35. The company’s standalone figure shows that the net profit was 244 cr.
Overall, the company’s fundamentals seem nice to me, as I am technical and will only take a trade for the short term. I have a mindset of BTST (buy today, sell tomorrow), which could be right. I am not denying that I don’t look at the fundamental figures too much because I believe that whatever is happening in the company can be seen through the chart.
What I saw in technical which entice me to buy
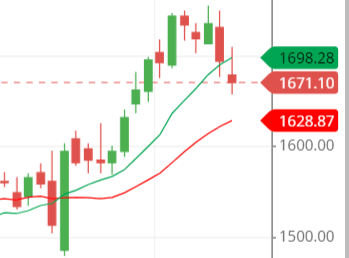
As I said, I bought it on 3rd January 2025. As you can see in the chart, the stock has made a bullish engulfing pattern combining the candlesticks on 1st and 2nd January 2025.

This is the first thing that made me think of buying the stock.
The second thing I saw was the moving average line. I looked at it and saw that the crossover of the 10-day SMA and the 21-day SMA had already happened. The stock was above the moving average line, which made me think that the stock is now in a bullish trend and could easily touch ₹ 1800 mark.
As the stock was above the all-time high price, so that’s why I couldn’t think of a resistance line and the only resistance that I thought of was a round figure, which was ₹ 1800.

Last thought on my loss
I know that the stock could go upside down in the future, but to make less exposure to the loss, I made a strict stop loss, I came out of it as fast as I could, but I think the stoploss that I made was accurate because I put the stoploss below the bullish engulfing candlestick, which was below the red candlestick (1st candle of bullish engulfing).


