ICIL shares fall under the textile sector and are included in the Textiles & Apparel industries.
Indo-Count Industries Limited (ICIL) manufactures grey combed cotton yarn and knitted fabrics.

As of September 2024, the public holding for ICIL shares remains at 26.89%; the promoter has the most significant share, 58.74%.
Please note that DII (Domestic Institutional Investors)has a 3.67% shareholding, and FII (Foreign Institutional Investors) has a 10.69% shareholding. This company also includes some of the other shareholding, which includes 0.01% of the total shareholding pattern.
Some of the crucial standalone figures as of the year 2024 are:
- Earning per share (EPS) remains at 16.17; in 2023, it was 12.03.
- ROE is 15.64, and in 2023 it was 13.49.
- Total income is 3378 cr. With EBIT remaining at 497 cr.
- Total expenditure is 2881 cr., and the net profit remains 320 cr.
- Reserves and surplus are 2007cr.
- Net cash flow is 15.
The stock has a diverse portfolio, which is meant to be one of the best things about any company’s shareholding pattern.
The price for the ICIL shares as of 16th December 2024, before the start of the market, is as follows:
Open – 381.70, High – 414.60, Low – 371 and close – 399.50.
Technical analysis
We have thus far obtained decent company fundamental figures. Now, let us discuss the crucial figures of the technical analysis by reading the chart.
What is the trend of ICIL share according to the trendline?
The trend seems to be in a downside trend channel.
After reading the chart, we can conclude that the stock might go down after hitting the present upside trendline.
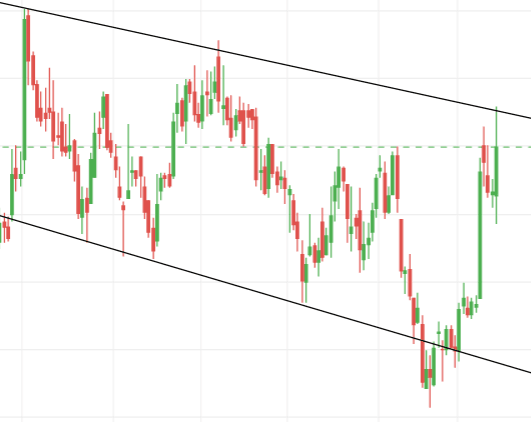
The stock has been in the channel for some time and might remain in the channel unless it breaks the upside trendline channel. So, the trend should be in the downside flow for now.
ICIL shares SMA (simple moving average) lines.
The chart shows that the 50-day SMA line (blue line) has cut the 10-day SMA line (green line) and gone down, which indicates the stock’s upside trend.
But what is interesting here is that the 21-day SMA line (red line) remains at the bottom, whereas in its place should be the 50-day SMA. Because of that, the stock moving average lines are not ascending, which means they can reverse at any time.
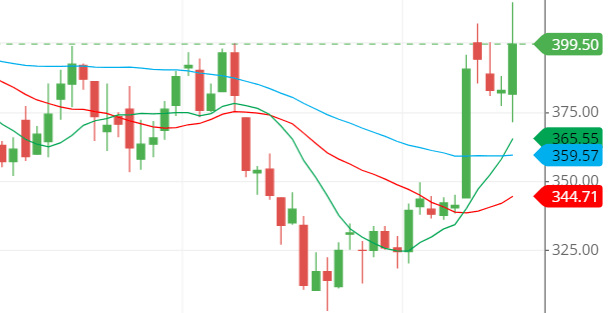
As the trendline suggests, the stock might be coming down as it had hit the upper trendline, and so do if we comply with the moving average. We get that the stock will be coming down in a few days.
Support & resistance of ICIL share
The support and resistance of the stock shown by the chart describe that the stock is now at the resistance level where it could come down because of the pressure it is getting on that level.
The stock seems to be at a very complicated level, with too many support and resistance levels, but to find the strongest resistance and support, follow the trendline.
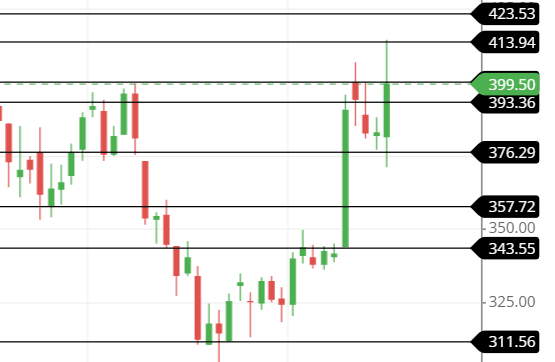
The three possible support and resistance levels are:
Support: 393, 376 and 355.
Resistance: 400, 422, and 444.
Chart & candlestick patterns of ICIL share
Candlestick pattern: The candlestick seems to be a spinning-top kind of candle, which indicates indecision in the stock. However, a possible reversal of the stocks could happen after analyzing the present technical figures, as mentioned above.
Chart pattern—The chart pattern shown by the stock is a falling channel chart pattern in which the stock falls in a downside flow channel. To clarify, look at the trendline image above the post.
Last thought on ICIL share
As the technical figures are too interested in letting the stock go down, the stock can face a downside movement at present.
However, as the fundamentals are diverse, many institutions and big bulls are there to rescue it, so going long-term would also be fine unless anything bad happens to fundamental figures and the company’s reputation.

