INDIAMART shares fall under the Retailing sector and are included in the Retailing industries.
INDIAMART mainly has three primary sources of business: buy leads, direct inquiries, and buyer calls.
As of December 2024, the public holding for INDIAMART shares remains at 15.83%; the promoter has 49.17%.
Please note that FII (Foreign Institutional Investors) has a 21.06% shareholding, and DII (Domestic Institutional Investors) has a 13.85% shareholding. In contrast, others have a 0.09% percentage shareholding.
The company has a good diversified shareholding pattern.
Some of the crucial standalone figures as of the year 2024 are:
- Earnings per share (EPS) remains at 59.84; in 2023, it was 89.14.
- ROE is 20.45, and in 2023 it was 13.18.
- Total income is 1308 cr. With EBIT remaining at 478 cr.
- Total expenditure is 829 cr., and the net profit remains 362 cr.
- Reserves and surplus are 1710.
- Net cash flow is 31.
The price for the INDIAMART share as of 11th January 2025
Open – 2100, High – 2157.80, Low – 2065.40 and close – 2092.10. (The figures might change as the market opens right now.)
The stock’s fundamentals are decent, and the figures suggest it can be a good long-term investment.
Technical analysis
Our technical analysis will be based on the figures of the trendline, SMA line, support & resistance, and chart & candlestick pattern.
What is the trend of INDIAMART share according to the trendline?
The stock’s present trend is down, as it is falling right now; any buying activity should be strictly prohibited unless a suitable opportunity arises.
The stock’s flow or movement goes from up to down as the stock goes downward. This is what happens in the downtrend movement.
INDIAMART shares SMA (simple moving average) lines.
Blue line – 50-day SMA; Red line – 21-day SMA; Green line – 10-day SMA.
The chart shows the stock has a downside tilt, and the SMA (simple moving average) does not correspond to it.
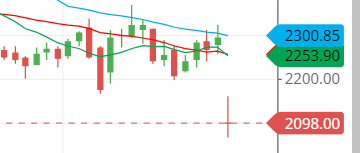
The three moving average lines, which are the 50, 21, and 10-day moving averages, all indicate the same thing: the selling pressure in the stock.
The stock price below the three SMA lines is too low, indicating bearishness and a lack of buying opportunities.
Support & resistance of INDIAMART share
The chart suggests that the stock is falling and that the next support level, around 2000, will likely be touched.
When the stocks experience a heavy fall, support levels are expected to be touched more than the resistance lines.
It seems that the stock might go down to touch level 1500 or consolidate near level 2000.
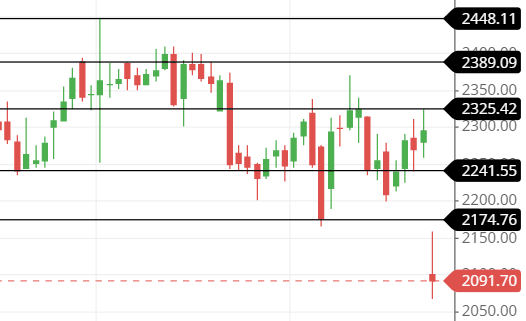
The three possible support and resistance levels are:
Support – 2025, 1922 and 1875.
Resistance – 2175, 2144, and 2325.
The above are some of the possible support and resistance lines that the stock might touch if the pace of its fall continues.
Chart & candlestick patterns of INDIAMART share
Candlestick pattern: The stock is now making a bearish engulfing pattern, the strongest sign that it will go down further.
Chart pattern: the chart pattern that the stock is making is a pattern where the stock shows bearish sentiment in the stock and keeps on falling until it gets some relief from the sellers.
The bearish chart pattern is what the stock is facing now.
Last thought on INDIAMART Share
As the stock is in a bearish trend, buying or thinking of entering anywhere in the stock until a good sign is seen would be stupid and a trap.
The whole sign in the technical analysis shows that the buying opportunity doesn’t exist right now.
Watch and see until a possible entering position is seen.

