ITI shares fall under the telecom sectors and are included in the telecommunications and equipment industries.
ITI was established in 1942, and it mainly works in telecommunications.

As of September 2024, the public holding for ITI shares remains at 2.02%; the promoter has 90%.
Please note that FII (Foreign Institutional Investors) has a 0.04% shareholding, and DII (Domestic Institutional Investors) has a 7.93% shareholding. In contrast, others have a 0.01% percentage shareholding.
The promoter has a 90% shareholding in the stock, and when this kind of holding is seen, the stock’s investors get more confidence as it implies safety.
Some of the crucial standalone figures as of the year 2024 are:
- Earnings per share (EPS) remains at -5.93; in 2023, it was -3.81.
- ROE is -32.52, and in 2023 it was -16.12.
- Total income is 1308 cr. With EBIT remaining at -327 cr.
- Total expenditure is 1635 cr., and the net profit remains -569 cr.
- Reserves and surplus are 788.
- Net cash flow is 95.
The price for the ITI share as of 3rd January 2025
Open – 385.50, High – 457.10, Low – 379.05 and close – 457.10.
Remember that the stock closed at its upper circuit price, which teaches us that the bullish pressure was too heavy in the present day.
Technical analysis
After obtaining the stock’s fundamental figures, let’s analyze some of its technical figures by reading the chart to better understand its present situation.
What is the trend of ITI share according to the trendline?
The chart shows that the stock is in an uptrend, as the flow of the stretched trendline on the chart is from down to up, indicating bullishness in the stock for the time being.
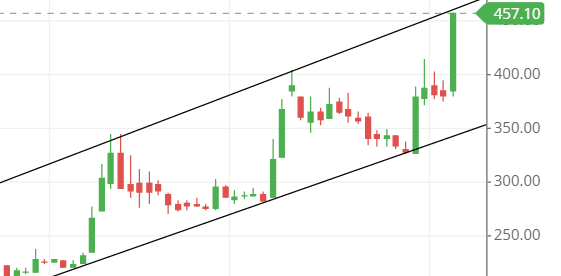
The stock closed at its all-time high of 457.10, indicating it might touch new highs in the coming days.
ITI. shares SMA (simple moving average) lines.
Blue line – 50-day SMA; Red line – 21-day SMA; Green line – 10-day SMA.
The SMA (simple moving average) line on the stock chart shows that the stock rises after every fall it faces within these two months.
It is indicated that the stock might be following the same procedure as it has shown within these two months of its journey.
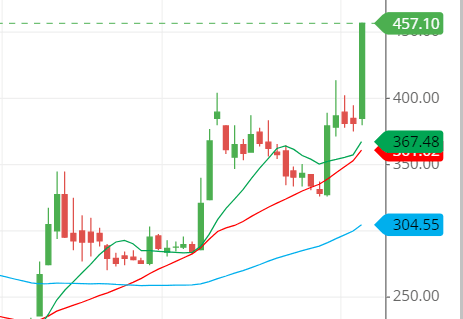
The stock price is above the three SMA lines, which means the stock is in a bullish trend now, and any buying opportunity should be taken.
As of now, it seems that the stock might easily touch the 500 mark within a few days.
Support & resistance of ITI share
As the chart shows, we should be taking the support and resistance figures of the trendline rather than the orthodox way of analyzing the support and resistance through the horizontal line.
The stock has broken the previous resistance line, which was around the 400 price level, and is journeying to make a new high, the highest it has ever made.
The three possible support and resistance levels are:
Support – 400, 375, and 350.
Resistance – 450, 475, and 500.
Chart & candlestick patterns of ITI share
Candlestick pattern: At present, the stock has made a bullish engulfing pattern, which is a strong indication of its bullish trend.
Chart pattern: It looks like the stock is making an ascending channel pattern, where the stock rises within the channel and goes to the upside, creating a bullish trend.
See the chart given in the trendline image above to understand better.
Last thought on ITI Share
The stock seems to be one of the best long-term investments, and analyzing its technicals gives more confidence in the buying side.
As of present, the stock seems to be going upside further, and buying could be commenced at the right price, for example, at the support level, which could give us the best possible opportunity to profit.

