KIOCL shares fall under the Metals & Mining sectors and are included in the iron & steel industries.
KIOCL shares mainly work in iron oxide pellets and pig iron manufacturing.

As of September 2024, the public holding for KIOCL shares remains at 0.88%; the promoter has 99.03%.
Please note that FII (Foreign Institutional Investors) has a 0% shareholding, and DII (Domestic Institutional Investors) has a 0.07% shareholding. In contrast, others have a 0.02% percentage shareholding.
The promoter has a massive holding in the stock, which is 99%, almost close to 100%.
Some of the crucial standalone figures as of the year 2024 are:
- Earnings per share (EPS) remains at -1.37; in 2023, it was -1.61.
- ROE is -4.34, and in 2023 it was -4.87.
- Total income is 1904 cr. With EBIT remaining at -49 cr.
- Total expenditure is 1954 cr., and the net profit remains -83 cr.
- Reserves and surplus are 1310.
- Net cash flow is -395.
The EBIT and the net profit are negative figures, which is a bit of a worry.
The price for the KIOCL share as of 6th January 2025
Open – 398, High – 453.70, Low – 396.70 and close – 433.
Technical analysis
After analyzing some of the company’s fundamental figures, let’s calculate some of its technical statistics to understand its outgoing situations better.
What is the trend of KIOCL share according to the trendline?
The stock is in a downtrend right now. The chart shows it is making a rising channel pattern and reacting within it.
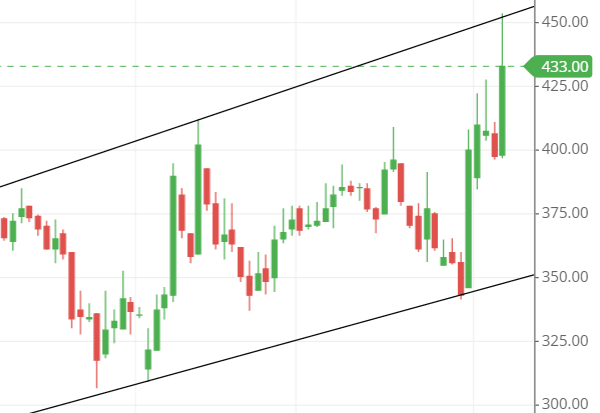
But as of now, the stock is in a downtrend movement with a bit of rise up from the down.
KIOCL shares SMA (simple moving average) lines.
Blue line – 50-day SMA; Red line – 21-day SMA; Green line – 10-day SMA.
The SMA (simple moving average) line does not entice a call on the stock’s upside.
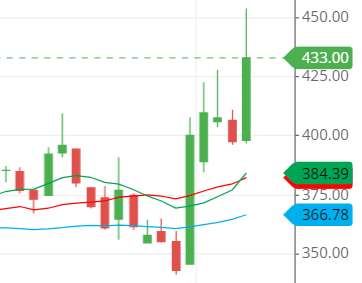
The price level is above the three SMA lines, indicating the stock’s bullishness. However, the structure of the three SMA lines is too accurate, making the price sustainable at the top.
Support & resistance of KIOCL share
The stock price came down after touching the above two resistance lines around levels 435 and 450.
The stock is preparing to touch the nearest support line around level 410. If it moves above that, a possible level of 500 can be seen shortly.
Within the previous five days, the stock has been making big bullish candles, which is a sign that the stock is bullish right now and can break any market norms.
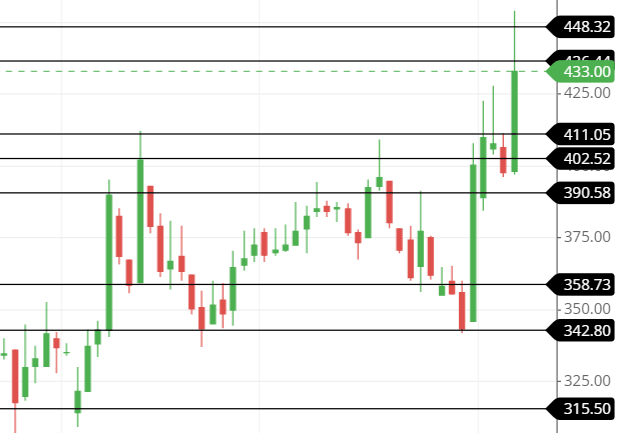
The three possible support and resistance levels are:
Support – 410, 400, and 390, but if it closes below 388, the possible support level of 350 can be seen.
Resistance – 435, 450, and 475.
Chart & candlestick patterns of KIOCL share
Candlestick pattern: The stock is making a bullish engulfing pattern right now, which is a sign of a bullish trend to start.
Chart pattern: see the trendline image above to understand the chart pattern.
The stock is trading within a rising channel. It touched that channel’s resistance and is preparing to touch its channel support line.
Trading within the channel is currently acceptable in the market and is a better option.
Last thought on KIOCL Share
We should go to the buy side if we believe in the candlestick pattern. However, if we analyze the channel within which the stock is trading, we should wait for the stock to touch the support line and then make a trade according to the chart the stock is making.

