KOTHARIPRO shares fall under the Trading sector and are included in the Trading industries.
KOTHARIPRO mainly works in real estate ventures, international trade, and securities investing.

As of September 2024, the public holding for KOTHARIPRO shares remains at 25.02%; the promoter has the most significant share, 74.97%.
Please note that FII (Foreign Institutional Investors) has a 0% shareholding, DII (Domestic Institutional Investors) has a 0% shareholding, and others have 0.01%.
According to the fundamental figures, stocks with no DII and FII shareholding are not good.
But this stock is one of the oldest in the market, having journeyed from a price of around 30 to 200.
So, from a holding perspective, it seems to be good, as its long-term return is amazing.
Some of the crucial standalone figures as of the year 2024 are:
- Earnings per share (EPS) remains at 4.08; in 2023, it was 0.49.
- ROE is 1.26, and in 2023 it was 0.15.
- Total income is 310 cr. With expenditure at 292 cr.
- EBIT remaining is 17 cr., and the net profit remains 12 cr.
- Reserves and surplus are 932.
- Net cash flow is 10.
The price for the KOTHARIPRO shares as of 27th December 2024
Open – 186.87, High – 215, Low – 186.84, and close – 200.50
The prices may vary as the market is open right now.
Technical analysis
Let us analyze some of the technical figures of the KOTHARIPRO stock to understand its ongoing movements.
What is the trend of KOTHARIPRO share according to the trendline?
The trendline in the chart suggests that the stock is going upside down. The flow of the trendline is from down to up, which means that the buying pressure is present in the stock right now.
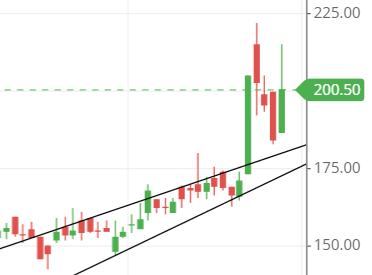
The stock seems to be around the upper trendline area, as the bottom trendline exists below the trendline, where the stock consolidated and broke out from there.
KOTHARIPRO shares SMA (simple moving average) lines.
Blue line – 50-day SMA; Red line – 21-day SMA; Green line – 10-day SMA.
If we look at the moving average line, the stock is in a bullish trend, and it can go upside down to touch a new price level.
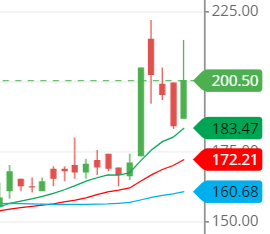
The price is above the three SMA (simple moving average) lines, which means the buying pressure is heavier than the selling pressure.
The structure of the moving average line is also good and enticing, which can encourage one to buy the stock.
As of now, the trendline and the moving average line suggest buying.
Support & resistance of KOTHARIPRO share
Well, if we talk about the stock’s support and resistance, the chart shows that the stock might be moving upside down to reach its nearest resistance line, around 210. If it hits, then there is a possibility that the stock might come back to hit the support level, which is around 190.
As of now, the stock has already hit the 210 mark. It’s planning to come down to hit the nearest support level, around 190. If it closes below that, then there are chances of it touching the second support level, around 176.
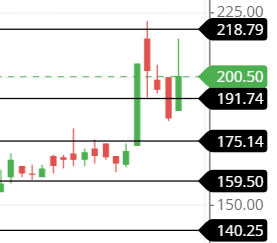
The three possible support and resistance levels are:
Support – 192, 176 and 161.
Resistance – 210, 222 and 244.
Chart & candlestick patterns of KOTHARIPRO share
Candlestick pattern: If the present candlestick closes above the previous candlestick, then a bullish, engulfing candlestick pattern will be formed, a strong indication for buying.
Chart pattern—The chart pattern seems to be a rising channel, and it has broken out of the channel where the stock was running.
It seems that it gave the price level for consolidating within the channel.
Last thought on KOTHARIPRO Share
The stock seems great for long-term investment, and for the technical, it too has the enticing figures to jump to the upside.
But for now, I think the price should come down a little, at least 30 to 40 points, to make a buying movement in the stock.

