MAPMYINDIA’s share comes under the software and IT services sector and is included in the software industry.
As of September 2024, the public holding for MAPMYINDIA shares remains at 36.14%, compared to 35.85% in June 2024. The promoter has the more significant shareholding of 51.67% as of September 2024.

Some of the crucial standalone figures as of the year 2024 are:
- Earning per share (EPS) remains at 25.42
- ROE is 20.95
- Total income is 356cr. With EBIT remaining at 178cr.
- Total expenditure is 177cr and the net profit remains at 137cr.
- Reserves and surplus are 645cr.
The price for the MAPMYINDIA share on 2nd December 2024 is as follows:
High – 1707.45, low – 1678.5, open – 1700, close – 1689.35.
After remarkable fundamental figures, let us find out the technical figures of MAPMYINDIA share.
Technical analysis
Today, we will try to find the technical figures based on RSI, Support and Resistance, chart pattern, Candlestick type, moving average, and what the trendline portrays about the chart’s emotions.
Moving average
We have taken the simple moving average of 50, 21 and 10 days to ensure our prediction result.
The chart shows a downside movement, and the SMA (simple moving average) of 50, 21, and 10 days, respectively, indicate the stock’s downside movement.
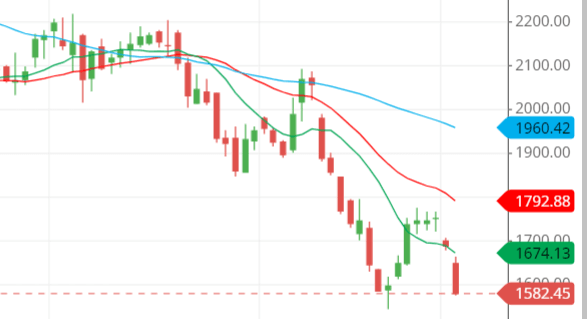
The stock will remain in the downtrend movement until the SMA lines reciprocate.
So, the SMA is not that interested in going upside down, and that’s why the downside movement is now prevailing in the stock of MAPMYINDIA.
RSI
The RSI for the stock of MAPMYINDIA remains at around 31, which suggests that buying can commence as it is above the oversold level.
Generally, if the RSI is above 20, buying has the best opportunity, and if it is around 80, selling is done.
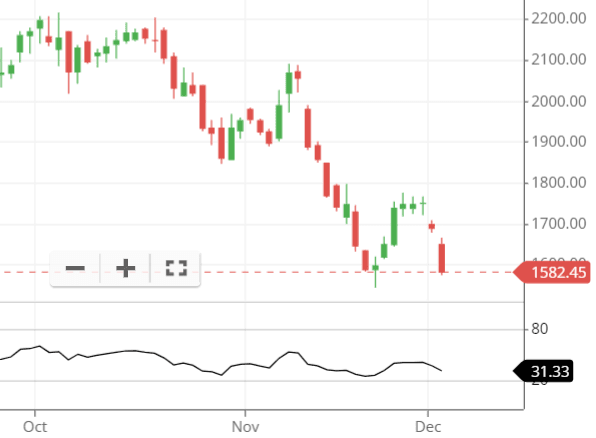
Mostly, we prefer buying over 40 RSI.
So, RSI is less attractive to look for a buying opportunity.
Support and Resistance
As per the chart, the stock is at around the strong support level, where the stock can bounce back to the nearest resistance level at around 1750.
Earlier, as the chart is displaying that the stock bounce backed from the level 1580 to touched the resistance at level around 1750.
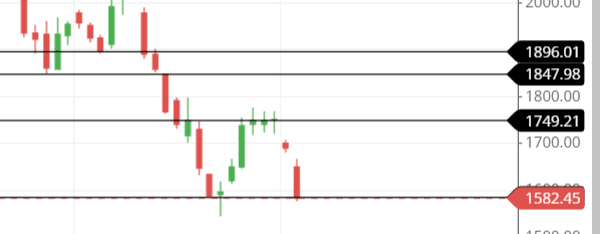
The next three resistance levels are that the stock could likely be touching the upcoming days are 1750, 1844 and 1894.
While if the stocks cut the present support line, then there is a possibility that the stock could go down to the level 1500 and 1400 which means that the heavy downfall could be seen.
Candlestick & chart pattern
The candlestick made on 29th November and 2nd December 2024 together combines to form a bearish engulfing pattern, which indicates a bearish trend in the stock for the time being.
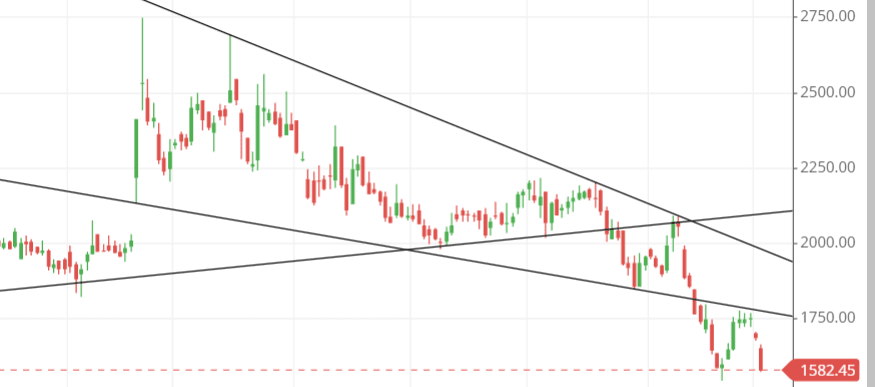
The chart patten is not seems to be encouraging enough to go for buying as the chart pattern seems to be that of which indicates a strong bearish trend in the market right now.
Even the trendline shows the bearish trend for the time being in the market, as we can also see the stock even cuts the bearish channel on which it was working and went down to the next level of bearishness.
Last Thought
After analyzing the technical of MAPMYINDIA share, we got that the chart is not that much interested in going upside for the time being at the present until the chart changes to a certain level where it displays a positive outlook for the buyers.

