MPSLTD shares fall under the Miscellaneous sector and are included in the printing & publishing industries.
MPSLTD mainly works in publishing solutions, which include typesetting and data digitization.

As of December 2024, the public holding for MPSLTD shares remains at 28.36%; the promoter has 68.34%.
Please note that FII (Foreign Institutional Investors) has a 2.02% shareholding, and DII (Domestic Institutional Investors) has a 0.43% shareholding. In contrast, others have a 0.85% percentage shareholding.
The company has a well-diversified shareholding pattern.
Some of the crucial standalone figures as of the year 2024 are:
- Earnings per share (EPS) remains at 62.75; in 2023, it was 50.47.
- ROE is 28.68, and in 2023 it was 24.51.
- Total income is 342 cr. With EBIT remaining at 144 cr.
- Total expenditure is 198 cr., and the net profit remains 106 cr.
- Reserves and surplus are 353.
- Net cash flow is 0, while it was 9 in 2023.
The price for the MPSLTD share as of 24th January 2025
Open – 2185, High – 2524.90, Low – 2185 and close – 2475. (The figures might change as the market is open right now.)
The stock’s fundamentals are decent, and short-term trading according to the fundamentals can be considered.
Technical analysis
Our technical analysis will be based on the figures of the trendline, SMA line, support & resistance, and chart & candlestick pattern.
What is the trend of MPSLTD share according to the trendline?
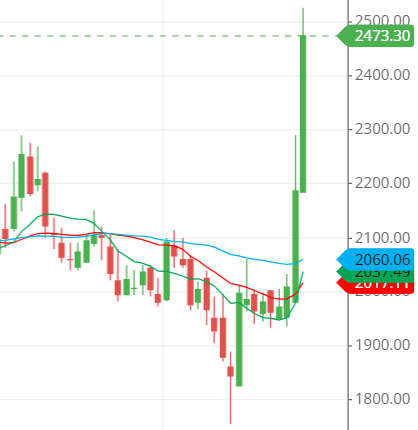
The chart shows that the stock is in an uptrend, as the price flow is on the upside.
As of today, the stock has made a low, and the open price is at the same, which shows the dominance of the buyers in the stock.
On the whole, the MPSLTD share is in an uptrend.
MPSLTD shares SMA (simple moving average) lines.
Blue line – 50-day SMA; Red line – 21-day SMA; Green line – 10-day SMA.
The chart shows that the stock’s moving average lines are a little messed up. The 50-day moving average should be below the 21-day moving average, but unfortunately, it is above it, which is not a good sign for the uptrend to sustain.

The three moving average lines, as depicted in the image, show that the stock price is above the three SMA (simple moving average) lines, which indicates the bullishness and the strength of the uptrend on the stock right now.\
Overall, the moving average doesn’t confirm the sustainability of the uptrend in the stock.
Support & resistance of MPSLTD share
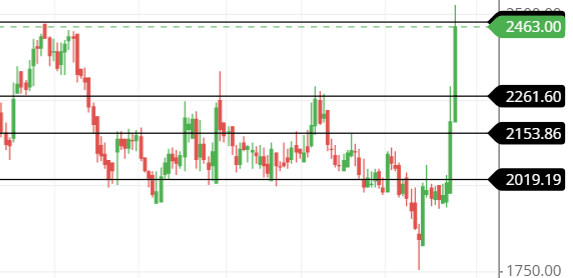
As we can determine from the stock chart, the stock has come down after touching strong resistance around the level of 2475.
It seems possible that the stock could be touching the support level, which is around level 2266.

The three possible support and resistance levels are:
Support – 2266, 2150 and 2022.
Resistance – 2475, 2500 and 2600.
Next, support levels are prone to being touched, as the stock touched its most vigorous resistance and came down concerning its resistance line.
Chart & candlestick patterns of MPSLTD share
Candlestick pattern: Big candles like Marubozu candles are in the making in the stock right now, where the stocks keep filling the buyer pressure in the candle, which becomes more extensive and taller.
Chart pattern: The stock is getting a bullish chart pattern, where it keeps on growing until it hits the resistance lines.
Last thought on MPSLTD Share
The stock has made a bullish run within these three days, and now it is getting resistance from its previously made resistance, and it is also respecting it.
So, it is certain that the stock will come down to touch its support level to make a move on the upside. Until then, we should wait for the stock to come or go to a level where the buying could be commenced with less harm.


