PAYTM shares fall under the software and IT services sector and are included in the online service industries.
PAYTM’s main work is to allow its consumers and the app’s user, as it is software, to make online and mobile payments.

As of September 2024, the public holding for PAYTM shares remains at 35.98%; the FII (Foreign Institutional Investors) has the most significant share, 55.53%.
Please note that DII (Domestic Institutional Investors)has an 8.48% shareholding.
Something shocking is that the promoter has no shareholding pattern.
Some of the crucial standalone figures as of the year 2024 are:
- Earning per share (EPS) remains at -23; in 2023, it was -29.
- ROE is -11.96, and in 2023 it was -15.10.
- Total income is 8185 cr. With EBIT remaining at -1452 cr.
- Total expenditure is 9638 cr., and the net profit remains -1476 cr.
- Reserves and surplus are 8632cr.
- Net cash flow is 840.
The annual net profit has been in minus figures for three consecutive years.
The price for the PAYTM shares as of 17th December 2024, as the market is running right now, the figures may vary.
Open – 1005, High – 1062.95, Low – 999.05, and close – 1022.
Technical analysis
After an overview of the fundamental figures of the PAYTM share.
Let us now discuss some of the important aspects of the technical analysis of the PAYTM share.
What is the trend of PAYTM share according to the trendline?
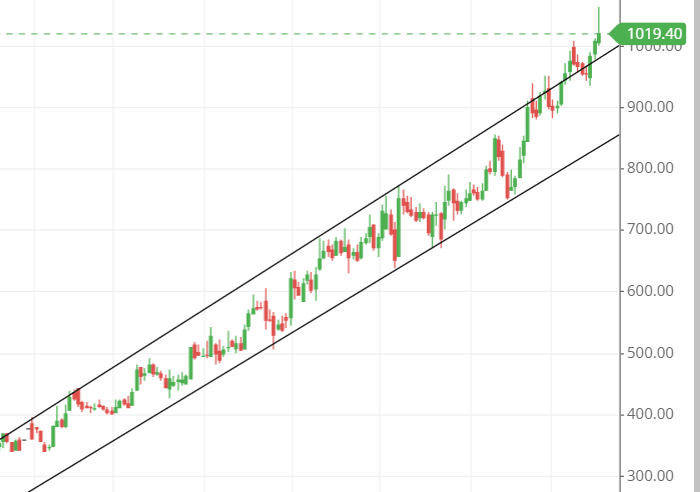
After hitting an all-time low at 310 prices on 9th May 2024, the stock never looked back and stepped ahead, moving in a single-up direction to reach the 1062.95 price mark.

From May 2024 to December 2024, the stock remained in an uptrend without losing its upside channel, which it is continuously running.
PAYTM shares SMA (simple moving average) lines.
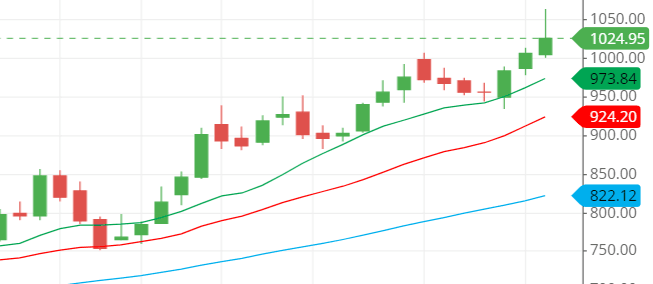
The blue line indicates the 50-day SMA, the red line indicates the 21-day SMA and the green line indicates the 10-day SMA.
All the lines are ascending and in proper shape, indicating the bullish pressure on the stock for the long-term Perspective.

The price levels are above the three lines, which also indicates that buying can be commenced for a short period of time unless anything changes in the stock.
This is one of the best structures of the moving average indicator, as shown in this PAYTM share, which is looked at and searched for by many to trade in.
Support & resistance of PAYTM share
The stock has consistently broken the resistance level to find the new price level at the upside, whereas, for the support level, the stock barely touched any previous support after breaking the resistance within this 3-to-2-month time frame.
Currently, the stock is going upside further to touch the 1100 price mark, a new milestone after the reversal from the downtrend that the stock saw last year and at the start of this year.
The three possible support and resistance levels are:
Support – 949, 929, and 900.
Resistance – 1050, 1075, and 1100.
However, if someone is looking for a long-term investment, then the stock can touch the 2000 price mark unless anything violates the chart by doing it.
Chart & candlestick patterns of PAYTM share
Candlestick pattern: The 12th and 13th of December 2024 make together the bullish engulfing pattern, which is the bullish and buyer sentiment candlestick formation.
Chart pattern -The chart pattern seems to be a rising channel pattern, where the stock rises in an upside channel flow, making higher highs at frequent intervals, as we can see in the trendline images above the post.
Last thought on PAYTM share
The stock fundamental figures are not that interesting from a long-term perspective. In contrast, the technical figures show something shocking, just opposite the fundamental figures, and that it entices us to look for a long time and be bullish.


