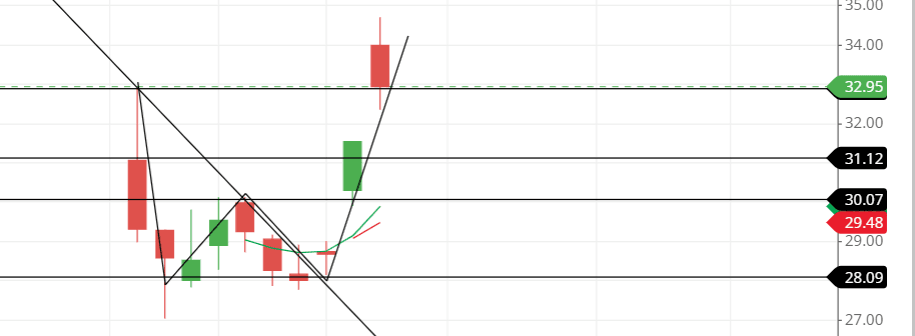
Sagility shares open up at a high gap up opening, breaking the high made by the stock ever.
Sagility India Ltd.’s Share falls under the Miscellaneous sector. It opened at 30.3 on 26th November 2024, reached a high of 31.54, a low of 29.9, and closed at 31.54.

Sagility’s share was listed on 12th November 2024, with an opening price of rupees 31.06. The share has seen an all-time low of 27.02.
Sagility is a new stock, so judging its all-time high and low doesn’t matter when deciding whether to invest in it. The stock does things every day that surprise its holders and serious traders.
Technical analyzation
Let us understand what the stock is trying to portray us with its technical figures before we decide whether to invest in it.
Moving average
As we have understood that Sagility is a new stock, getting a result from SMA or any moving average is not possible, so that’s why we will be analyzing it using a shorter period of SMA (simple moving average), which will be 9 days SMA and 5 days SMA.
After getting the 9-day SMA and 5-day SMA on the chart, we can see that the stock price is above the moving average of the respective we have mentioned, which indicates a strong bullishness in the stock at present, both for traders and investors.
If we love taking trades or investing on moving average crossover, the charts show that the 5-day SMA has crossed the 9-day SMA, which means buying has the probability in the stock right.

Buying should be commenced whenever the shorter period of the SMA crosses the more extended period. There are other factors, too, but this is one where we can consider buying the stock for future growth.
Support and resistance
Support and resistance are essential for judging stock jumping and resting places, making a trade smoother and flawless.
As seen in the chart, the stock faces strong support at around level 28 and jumps from around 34, breaking its all-time high.
The stock faced strong resi, a stance at level 3facedt rejecting all its norms; the stock gapped above price 30, breaking the resistance it had made.
As for the present, the support and resistance levels are:
A support level is around 30, 31, and 32.80.
The resistance level is around 34, 35, and 39.40.
Candlestick and chart patterns
The candlestick patterns for 25th November and 26th November together form a bullish engulfing pattern. Whenever this pattern is made, buying happens, and bullishness prevails in the market if all the conditions of the bullish engulfing are fulfilled.
Chart patterns are like patterns formed after the stock rises from the downside, breaking the trendline and going to the upside. The chart pattern is a W-shaped pattern.
A W-shaped or double-bottom pattern indicates a bearish reversal in the stock. At present, the price may move upside down to create a bullish trend.
Last thought
It might go up after analyzing the stock’s technical figures; if not, something worries us. Being patient and following the chart and related news circulating in the market would make our analysis accurate.
Let us know what is happening in the stock with its news.


