SIGNPOST shares fall under the Media & Entertainment sector and are included in the Media industries.
SIGNPOST (Signpost India) mainly works in Digital out-of-home media enterprises with various advertising solutions.

As of September 2024, the public holding for SIGNPOST shares remains at 25.64%; the promoter has the most significant share, 74.32%.
Please note that FII (Foreign Institutional Investors) has a 0.03% shareholding, while DII (Domestic Institutional Investors)has a 0.01% shareholding.
As the stock is new and listed on 14th February 2024 this year, the fundamental figures seem fresh and low.
Some of the crucial standalone figures as of the year 2024 are:
- Earning per share (EPS) remains at 8.24; in 2023, it was 6.64.
- ROE is 23.32, and in 2023 it was 24.09.
- Total income is 395 cr. With EBIT remaining at 74 cr.
- Total expenditure is 321 cr., and the net profit remains 44 cr.
- Reserves and surplus are 178.
- Net cash flow is 7, as it was -2 in 2023.
The price for the SIGNPOST shares as of 21 December 2024
Open – 358.95, High – 399.80, Low – 351.40, and close – 390.50.
The prices may vary as the market is open right now.
Technical analysis
After the fundamental analysis of the company, let us now talk about some of the technical analysis figures to understand the ongoing process better.
What is the trend of SIGNPOST share according to the trendline?
The trendline is under the price level and going from down to up, indicating a strong uptrend and bullishness in the stock.
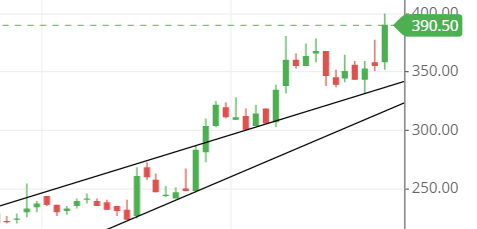
The buying pressure remains high on the stock, and the stock is being taken upside down to make a new high.
From the trendline perspective, buying is indicating.
SIGNPOST shares SMA (simple moving average) lines.
Blue line – 50-day SMA; Red line – 21-day SMA; Green line – 10-day SMA.
Right now, The stock is one of the best moving average line structures, which can tend traders to take a trade in it.
As we can see in the chart, the stock’s price is above the three SMA (simple moving average) lines, indicating the stock is going upside down.
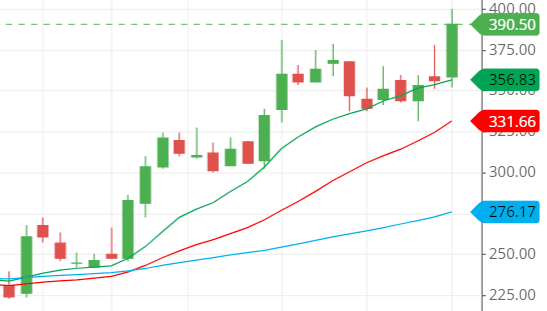
The price is now touching the 10-day SMA line and moving upside with its support, slowly and steadily, which is the plus point.
With the help of the moving average line, we can judge that the stock will be going upside in the coming days.
Support & resistance of SIGNPOST share
In this market where the stock continuously moves upside down, the support is meant to be nothing, as the resistance keeps breaking.
And the stock is achieving new feats as it goes upside down.
Mostly, resistance is meant to be strong in this kind of market as the stock frequently comes to the support level in this kind of market where heavy buying pressure is generated.
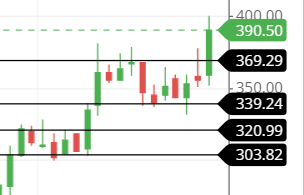
The three possible support and resistance levels are:
Support – 370, 340 and 320.
Resistance – 400, 425 and 450.
Chart & candlestick patterns of SIGNPOST share
Candlestick pattern – The stock now has a bullish, engulfing kind of structure, which is a bullish sign for further moving the stock price upside down.
Chart pattern – the stock seems to be in a rising channel pattern, moving upside down within the self-made channel made by itself in the chart.
On the other hand, the stock is indicating a bullish trend.
Last thought on SIGNPOST Share
The technical of the SIGNPOST share indicates that the chart has a bullish trend and will continue to move upside unless anything happens that causes the stock to move downside.
However, it strongly indicates that the stock should be moved upside down.

