SIYSIL shares fall under the Textiles sector and are included in the Textiles & Apparel industries.
SIYSIL (Siyaram Silk Mills Ltd) mainly works on producing blended fabrics.

As of September 2024, the public holding for SIYSIL shares remains at 28.56%; the promoter has 67.44%.
Please note that FII (Foreign Institutional Investors) has the most significant share, with a 1.48% shareholding, and DII (Domestic Institutional Investors) has a 2.52% shareholding. In contrast, others have a 0% percentage shareholding.
Some of the crucial standalone figures as of the year 2024 are:
- Earnings per share (EPS) remains at 39.98; in 2023, it was 53.73.
- ROE is 16.18, and in 2023 it was 22.07.
- Total income is 2124 cr. With EBIT remaining at 267 cr.
- Total expenditure is 1857 cr., and the net profit remains 184 cr.
- Reserves and surplus are 1131.
- Net cash flow is 2.
The price for the SIYSIL shares as of 28th December 2024
Open – 853, High – 918.60, Low – 842.40, and close – 907.70.
As the market is open right now, the prices may vary.
Technical analysis
Let’s examine some of the stock’s technical figures to understand its nature better.
What is the trend of SIYSIL share according to the trendline?
The trendline in the daily chart suggests that the stock is now facing an uptrend.
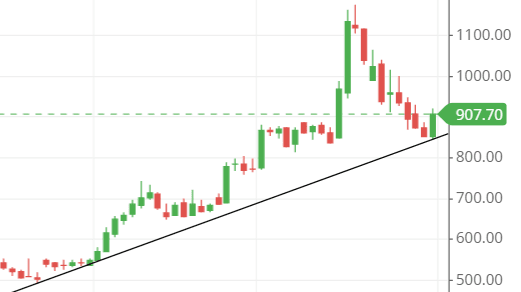
After hitting the high at around 1150, the stock came down to touch the trendline and possibly sustained there for a jump back to touch the new high.
SIYSIL shares SMA (simple moving average) lines.
Blue line – 50-day SMA; Red line – 21-day SMA; Green line – 10-day SMA.
The stock price seems to be below the 21-day SMA line, which suggests that it might face resistance on the line, which can cause it to come down.
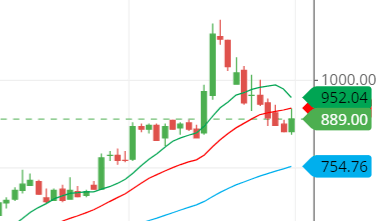
The stock is above the 50-day SMA line, indicating it might soon move to the upside. It will be taking support from the 50-day SMA line.
The buyers should wait until the SMA (simple average line) becomes accurate, indicating a strong buy signal.
Support & resistance of SIYSIL share
The stock is currently sustaining at the support level of around 890, and it might be preparing to go upside and touch the nearest resistance level, around 1150.
But if the stock fails and comes down, it might go down to a bearish trend and consolidate for some time. Then, after the consolidation, a new trend will follow and reach the highest resistance level.
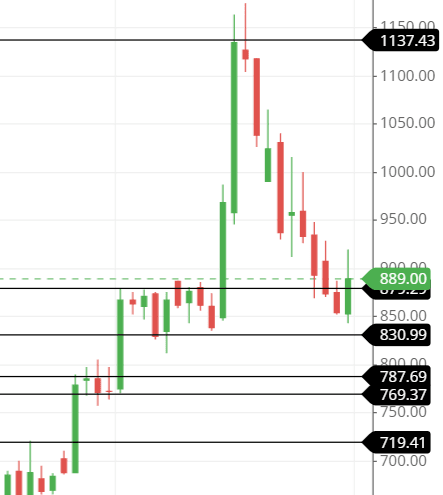
The three possible support and resistance levels are:
Support – 890, 825, and 775.
Resistance – 950, 1000 and 1150.
Chart & candlestick patterns of SIYSIL share
Candlestick pattern: If the stock successfully creates a candlestick that closes above yesterday’s high, then the bullish, engulfing candlestick pattern will be created, strongly indicating an uptrend in the price.
Chart pattern: The stock seems to be making the N-shaped pattern, but it is not confirmed as the making is in progress. If the stock falls to the downside, the N-shaped pattern will not be formed.
To make an N-shaped pattern, the stock needs to go upside down.
Last thought on SIYSIL Share
The stock was bullish from the start of November 2024, and now, at the end of December 2024, it has come down to consolidate the rise it has shown within these two months.
The trendline and moving average line show that the stock has a chance of going to the upside shortly. However, for now, the stock should be judged for a moment, and buying should commence when the best opportunity comes, for example, when the stock closes above 1000 and comes above the 10-day SMA lines.

