SPANDANA shares fall under the finance sector and are included in the finance – NBFC industries.
SPANDANA mainly works in the micro-loans segment, specifically catering to women borrowers.

As of September 2024, the public holding for SPANDANA shares remains at 14.19%; the promoter has 55.83%.
Please note that FII (Foreign Institutional Investors) has a 22.64% shareholding, and DII (Domestic Institutional Investors) has a 7.33% shareholding. In contrast, others have a 0.01% percentage shareholding.
The company has a good diversified shareholding pattern.
Some of the crucial standalone figures as of the year 2024 are:
- Earnings per share (EPS) remains at 65.81; in 2023, it was 1.74.
- ROE is 13.15, and in 2023 it was 0.4.
- Total income is 2406 cr. With EBIT remaining at 1523 cr.
- Total expenditure is 883 cr., and the net profit remains 467 cr.
- Reserves and surplus are 3422.
- Net cash flow is 575.
The price for the SPANDANA share as of 11th January 2025
Open – 450, High – 450, Low – 405.80 and close – 405.80.
The stock’s fundamentals are decent, and the figures suggest it can be a good long-term investment.
Technical analysis
Our technical analysis will be based on the figures of the trendline, SMA line, support and resistance and chart & candlestick pattern.
What is the trend of SPANDANA share according to the trendline?
The present trend of the SPANDANA stock is bearish or downtrend, as the stock is continuously falling.
The stock saw a slight surge on January 7th and 8th, 2025, but as the chart shows, it continued its trend.
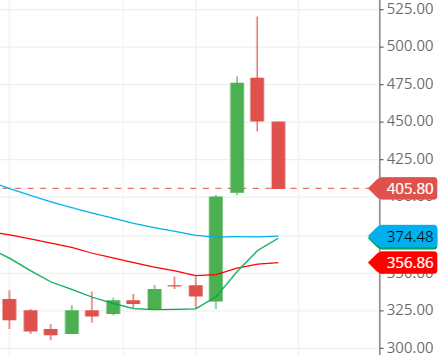
SPANDANA. shares SMA (simple moving average) lines.
Blue line – 50-day SMA; Red line – 21-day SMA; Green line – 10-day SMA.
The chart shows that the stock’s 50-day SMA line is on the upside of the 10-day and 21-day SMA lines, which indicates that the stock is trapped in a bearish trend.

The stock price is above the three given SMA (simple moving average) lines, which is usually suitable for a bullish trend. However, the chart shows it is a little complicated, as the three moving average lines are messed up, and no clear indication of the bullish trend is shown.
So, the stock should be avoided until any good surges in the price are seen.
Support & resistance of SPANDANA share
When the stock is falling, especially in a bearish trend, the support lines are likely to be hit regardless of the resistance lines on the upside.
The falling stock breaks even the strongest support lines if the sentiment of the sellers is high on the stock.
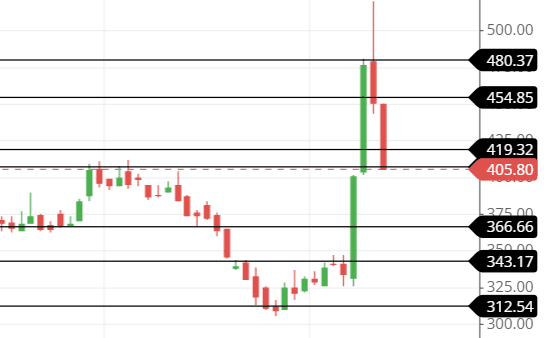
The chart shows that the stock is falling rapidly, and no support levels are strong enough to hold it for a moment.

The three possible support and resistance levels are:
Support – 375, 350 and 325.
Resistance – 425, 450 and 475.
The above are some of the possible support and resistance lines that the stock might touch if the pace of its fall slows.
Chart & candlestick patterns of SPANDANA share
Candlestick pattern: The stock’s current candlestick pattern is the Bearish Marubozu candlestick pattern, which indicates a bearish trend, with the stock falling to touch its previously made support lines.
Chart pattern: The chart pattern in the stock shows the stock keeps on falling down, and a little surge is engulfing its falling pressure for the moment.
The bearish chart pattern is what the stock is facing now.
Last thought on SPANDANA Share
Everything discussed above tells us that the stock is in a bearish trend, and any buying activities could affect our profit percentage.
So, we should avoid the stock right now and only become involved when it shows little bullish pressure, such as when it cuts another bearish trendline.


