TATA ELXSI shares fall under the Software & Its services sector and are included in the Software industries.
TATA ELXSI mainly works in system integration and software development.

As of September 2024, the public holding for TATA ELXSI shares remains at 35.04%; the promoter has the most significant share, 43.91%. Others got 0.02% shareholding.
Please note that FII (Foreign Institutional Investors) has a 13.65% shareholding, while DII (Domestic Institutional Investors)has a 7.38% shareholding.
Tata Elxsi has a diverse shareholding pattern, which is good for long-term investing.
Some of the crucial standalone figures as of the year 2024 are:
- Earning per share (EPS) remains at 127.21; in 2023, it was 121.26.
- ROE is 31.61, and in 2023 it was 36.20.
- Total income is 3674 cr. With EBIT remaining at 1068 cr.
- Total expenditure is 2605 cr., and the net profit remains 792 cr.
- Reserves and surplus are 2443cr.
- Net cash flow is 0, as it was -17 in 2023.
The price for the TATA ELXSI shares as of 20 December 2024. As the market is running right now, the figures may vary.
Open – 7301.05, High – 7325, Low – 7013.50, and close – 7044.65.
Technical analysis
After obtaining some of the best fundamental figures, let us now discuss some of the technical figures of the Tata Elxsi share to get the best outlook for the share’s present situation.
What is the trend of TATA ELXSI share according to the trendline?
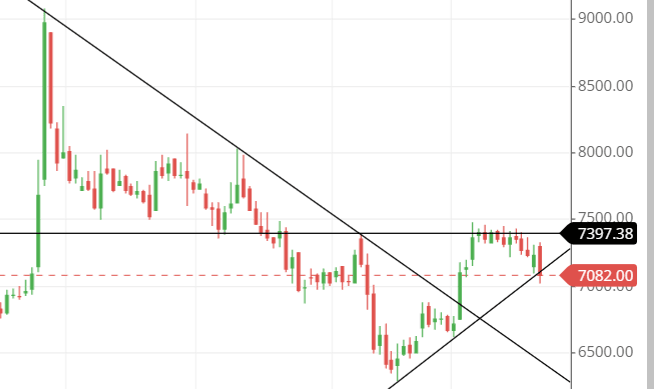
The stock’s chart shows that it reached a high of 9080 on 27 August 2024 and has since fallen to its present price of around 7000.
As of now, the stock is in a downtrend for the long-term view, and for a shorter time, the stock seems to be a little bullish, but that is not what it will perform as the market bears are heavy in this stock.

The lower trendline suggests that the stock is going upside down, but the resistance on the upside is not letting it become bullish, and the pressure is maintained.
So, the stock is facing a downtrend right now unless anything changes.
TATA ELXSI shares SMA (simple moving average) lines.
Blue line – 50-day SMA; Red line – 21-day SMA; Green line – 10-day SMA.
The moving averages, as seen in the chart, are in line, which suggests that the stock will move upside in the near future.
However, the structure of the SMA (simple moving average) line is not that interesting. It is a little messed up and not unclear, and it could change time as the price declines or rises. Overall, it is not stable at the moment.

As the chart says, the candlestick is stuck between the three SMA lines, and to judge anything from here will not be accurate.
If the SMA follows the trendline, then it seems that the stock might be going down further.
Support & resistance of TATA ELXSI share
It is one of the stocks that follow the support and resistance lines too much.
The previous support and resistance lines are too strong, and the stock can react there with too much respect.
Currently, the stock is going down to touch the resistance line, which is around level 6975. If it closes below figure 6850, then the stock could go down further to touch the 6500-level mark.

The three possible support and resistance levels are:
Support – 6975, 6850 and 6700
Resistance – 7350, 7525 and 7925.
This is one of the stocks whose price volatility is always too much.
Chart & candlestick patterns of TATA ELXSI share
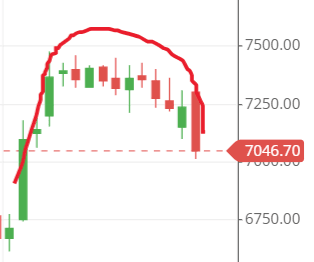
Candlestick pattern—The bearish engulfing candlestick is what the stock is making right now, which indicates that it could go further down the road as it is a bearish sign.
Chart pattern—As of now, the chart shows that the stock is making a rounding top pattern, which is again a bearish sign that a stock will go downside.

Last thought on TATA ELXSI Share
After analyzing the stock, we can conclude it might face a downtrend. Still, the stock has better fundamental figures that can reverse the price sometime in the future, and if it goes, then it is possible to touch the 9000-price level again.
As of 2025, the stock could possibly make a new level mark of 12000, but the target would be the previous high made by the stock, which is 9080.


