Bullish candlestick patterns are the patterns that help the
stock recover from a downtrend to an uptrend or to continue its natural trend.
stock recover from a downtrend to an uptrend or to continue its natural trend.
The word Bullish simply means that the stock or shares are going upside
and ending or closing in a green candle, denoting the profit of the shares.
and ending or closing in a green candle, denoting the profit of the shares.
There are certain patterns in the candlestick chart that indicate the
bullishness of the stock in the near future or in the coming days.
bullishness of the stock in the near future or in the coming days.
It’s just that we need to identify it and use it in our trading skills.
The top 5 profitable bullish candlestick patterns
Below are listed five of the most commonly used bullish candlestick patterns.
They are used in day-to-day trading, and for investing purposes, they are also
highly used.
They are used in day-to-day trading, and for investing purposes, they are also
highly used.
And the top 5 bullish candlestick patterns are:
5. Three white soldiers
In this candlestick pattern, the traders usually don’t go for too long, as
it is basically for short-term buying.
it is basically for short-term buying.
Here, the word “white” doesn’t always mean white, as there are some candlestick charts that
allow the user to use the white and black color bodies of the
candle.
allow the user to use the white and black color bodies of the
candle.
Normally, we will see the green and red bodies of the candle, denoting the
bullishness and bearishness of the candle.
bullishness and bearishness of the candle.
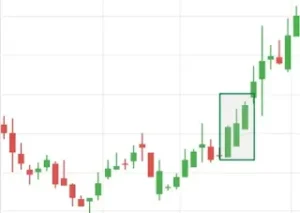
The three white soldiers are the three candles with a green
color or bullishness, indicating the pressure of buying the stock.
color or bullishness, indicating the pressure of buying the stock.
After the first candle opens and closes in green with no wick or small
wick, the second candle opens inside the first candle and closes above the
first candle, and then the third candle opens inside the body of the
second candle and closes above the second candle.
wick, the second candle opens inside the first candle and closes above the
first candle, and then the third candle opens inside the body of the
second candle and closes above the second candle.
 |
| Three white soldiers |
Basically, we need to remember that each candle should open inside the
previous candle and close above the high of the previous candle.
previous candle and close above the high of the previous candle.
What do the three white soldiers tell us?
As we know, the three candles continuously closing in green indicate the
buying pressure on the shares, so the sentiment remains the same of going
above and beyond.
buying pressure on the shares, so the sentiment remains the same of going
above and beyond.
Possible direction: upside or continuation to the sideways market.
Basically, it is being searched for at the bottom of the bearish trend so
that a good opportunity may be acquired to go upside.
that a good opportunity may be acquired to go upside.
But remember that if it is found on the sideways market, then there is a
lot of possibility for it to continue the sideways trend until it breaks
out with volume.
lot of possibility for it to continue the sideways trend until it breaks
out with volume.
4. Piercing line pattern
It is one of the most common patterns used for looking at the bullish
pattern to determine the bullish trend.
pattern to determine the bullish trend.
The piercing line pattern is a pattern whose importance becomes very
strong if it is found at the bottom of the bearish trend.
strong if it is found at the bottom of the bearish trend.
How does the piercing line pattern look?
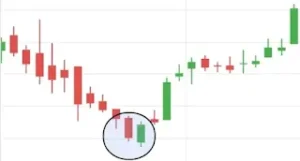
A piercing line pattern is a two-candle pattern; the first
candle is a bearish candle, and the second candle is a bullish candle.
candle is a bearish candle, and the second candle is a bullish candle.
 |
| Piercing line |
The second candle is a gap down and closes above 50% of the first
candle, which is a bearish candle.
candle, which is a bearish candle.
What does the piercing line pattern tell us?
The piercing line pattern is actually an accumulation of the sellers
that were active on the previous day, and on the present day, the buyers
get active and finish the ongoing struggle of buyers with sellers.
that were active on the previous day, and on the present day, the buyers
get active and finish the ongoing struggle of buyers with sellers.
Possible direction: trend reversal
It reverses the trend of the stocks to a bullish trend; its value
increases more when it happens to be found at the bottom of the bearish
trend as it reverses to the bullish trend in the near future.
increases more when it happens to be found at the bottom of the bearish
trend as it reverses to the bullish trend in the near future.
but if found in the middle of the bearish or bullish trend, then
continuation is general; otherwise, reversal is not that effective.
continuation is general; otherwise, reversal is not that effective.
3. Kicker Bullish
It is related to the gap up in the stock from the previous candle.
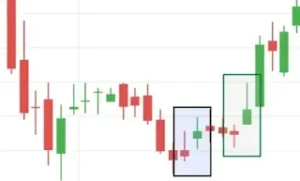
The bullish kicker is a two-candlestick pattern that occurs with a big
red candle or bearish candle and is followed by a gap-up big bullish
candle or green candle.
red candle or bearish candle and is followed by a gap-up big bullish
candle or green candle.
Basically, it is seen that the size of the candle is not required that
much to confirm the bullish kicker pattern.
much to confirm the bullish kicker pattern.
The important thing to notice is that there are two candles, one bearish
and the other bullish, with a gap-up opening.
and the other bullish, with a gap-up opening.
 |
| Bullish kicker |
The effectiveness of the candle increases when it happens to gap up with
good volume and is seen with a positive indication from indicators like
RSI, MACD, etc.
good volume and is seen with a positive indication from indicators like
RSI, MACD, etc.
What does the bullish kicker tell us?
The Bullish kicker is basically seen at the bottom of the
bearish trend to predict a good bullish trend thereafter.
bearish trend to predict a good bullish trend thereafter.
Possible directions:
reverses to a bullish trend (reversal)
reverses to a bullish trend (reversal)
The sentiment of the stock changes after a gap-up bullish candle, which
completely accumulates the previous bearish candle sellers.
completely accumulates the previous bearish candle sellers.
To confirm the strongness of the bullish kicker pattern, a good volume
is seen on the second candle.
is seen on the second candle.
But note that if it happens anywhere in the middle of any trend, whether
bullish, bearish, or sideways, then it normally follows its natural trend
or may go to the other side in certain cases, like news-related
sentiments.
bullish, bearish, or sideways, then it normally follows its natural trend
or may go to the other side in certain cases, like news-related
sentiments.
2. Morning star pattern
The morning star is the second-most reliable bullish
candlestick pattern in the candlestick chart. Its success rate is really
exciting, as it makes a trade very simple in terms of its
identification.
candlestick pattern in the candlestick chart. Its success rate is really
exciting, as it makes a trade very simple in terms of its
identification.
 |
| Morning star pattern |
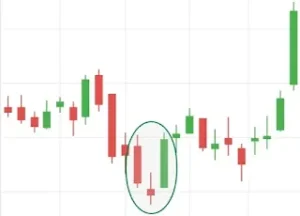
The morning star candle pattern has a very simple formation; it
comprises three candle formations, and they are:
comprises three candle formations, and they are:
- The first candle is a bearish candle, which usually describes the
lower low and lower high and is large in size. - The second candle is a gap-down candle, which is usually small in
size and sometimes seems to be a spinning top-like candle; it can
be either bullish or bearish in nature. and - The third candle is a gap-up candle, big in size and bullish in
nature.
What does the morning star candle tell us?
The morning star candle happens to be at the bottom of the bearish
trend; as it is a bullish reversal trend pattern, it reverses the
bearish trend to a bullish trend.
trend; as it is a bullish reversal trend pattern, it reverses the
bearish trend to a bullish trend.
Possible directions:
reversal to a bullish trend.
reversal to a bullish trend.
The 1st candle is a
bearish candle whose volume is very large, and normally the sellers are
higher than the buyers.
bearish candle whose volume is very large, and normally the sellers are
higher than the buyers.
The 2nd candle of the
morning star pattern depicts the indecisiveness in the stock, and
morning star pattern depicts the indecisiveness in the stock, and
The 3rd candle finishes
the bearishness of the stock, and the buyer becomes heavier than the
seller. and initiate the start of bullishness in the stock.
the bearishness of the stock, and the buyer becomes heavier than the
seller. and initiate the start of bullishness in the stock.
1. Bullish engulfing pattern
The bullish engulfing pattern is the most used and trusted pattern in
the candlestick chart; not only this, but it is also the most reliable.
the candlestick chart; not only this, but it is also the most reliable.
Before discussing the formation of the bullish engulfing pattern, it is
important to remember that there may be different shapes and sizes to
denote the bullish engulfing pattern.
important to remember that there may be different shapes and sizes to
denote the bullish engulfing pattern.
But the most acceptable formation of the
bullish engulfing pattern is that the first candle will be
bearish or red in color, and the second candle will open the gap down
and fully cover the previous red candle body. The second candle beats
the low of the first candle by making it lower than its low and higher
than the previous candle’s high.
As a result, the second candle becomes green or bullish in nature.
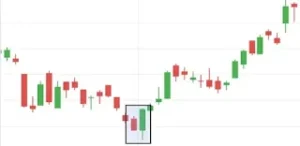 |
| Bullish engulfing |
Another simple formation of the bullish engulfing pattern is: one red or
bearish candle, the second green or bullish candle, and the second
closed above the high of the previous red or bearish candle, making a
simple bullish engulfing pattern.
bearish candle, the second green or bullish candle, and the second
closed above the high of the previous red or bearish candle, making a
simple bullish engulfing pattern.
What does the bullish engulfing pattern tell us?
A bullish engulfing pattern is one whose value increases if it is made
at the bottom of the beaish trend.
at the bottom of the beaish trend.
Possible directions:
reversal of the bullish trend
reversal of the bullish trend
The first candle is bearish, which tells us that the sellers are heavy
on buyers, and the second candle makes the seller fully exhausted and
starts a new trend.
on buyers, and the second candle makes the seller fully exhausted and
starts a new trend.
The volume at the second candle is really important; if the candle has a
good volume, then the confirmation of the bullish engulfing pattern
somewhere is confirmed.
good volume, then the confirmation of the bullish engulfing pattern
somewhere is confirmed.
Final thoughts
The above-mentioned candlestick patterns are the best bullish
candlestick patterns used by both investors and traders to take any
trade on the long side.
candlestick patterns used by both investors and traders to take any
trade on the long side.
The only thing that is needed is a correct analysis of the patterns,
because sometimes people unknowingly believe the wrong pattern to be the
correct pattern. For example, not every engulfing pattern is a bullish
engulfing pattern, as most traders believe it to be.
because sometimes people unknowingly believe the wrong pattern to be the
correct pattern. For example, not every engulfing pattern is a bullish
engulfing pattern, as most traders believe it to be.
Be cautious while using any of the patterns for your trading. Use a
stoploss in every trade you take with a proper study of the market, and
you will be profitable with less loss.
stoploss in every trade you take with a proper study of the market, and
you will be profitable with less loss.
So why wait? Go and use it. For other queries, please let me know in the
comment section.
comment section.
FAQs on the bullish candlestick patterns
Here are some of the frequently asked questions related to the bullish candlestick patterns:
- What is a bullish candlestick pattern?
- A bullish candlestick pattern is a pattern formed in the candlestick chart that indicates the upgoing of the stocks or increasing the price of the stocks.
- What is a bullish candlestick pattern?
- Which is the best bullish candlestick pattern to be used in trading?
- The top 5 mentioned above are the best; the bullish engulfing pattern is considered the most used one.
- Which is the best bullish candlestick pattern to be used in trading?


