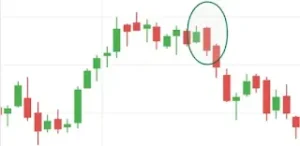
Bearish candlestick patterns are the patterns that indicate a
down trend or a reduction in the price of the stock in the coming days.
Bearish candlestick patterns are basically for traders who are interested in
the selling perspective of the market.
Sellers are enthusiastic about finding bearish candlestick patterns because it
widens the chance of profit on the down side of the market.
Candlestick patterns are made to inform traders about three things: the
bullishness of the price, the bearishness of the price, and the continuation
of the price.
Bearish candlesticks are traded mostly on the intraday, on the index, and on
futures. It is important to remember that we cannot hold the sale items in our
demat account on a daily basis. To hold the sold stocks or items, we need to
buy the put on the index side and the sell on the future side.
The top 5 bearish candlestick patterns are:
Below are the top 5 bearish candlestick patterns.
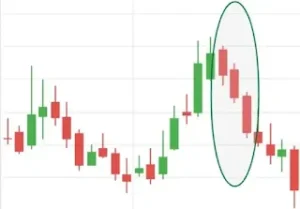
5. Three black crows
The three black crows consist of three candles, all of which are red or
bearish in nature, which speaks about the falling price of the stock.
Three black crows have too much importance when they are found
at the top of the
bullish trend because it increases the chance of falling
down.
Basically, it is a bearish reversal candlestick pattern that is used for
selling the stock to get profit from the down side.
What is the formation of the three black crows?
The three black crows are the structure of the three candles, in which the
first candle closed in red or bearish.
The second opened inside the first bearish candle and closed in red or
bearish, making it lower than the previous candle. and
The third candle opened somewhere inside the second candle and ended up
closing in red or bearish, making a new low.
 |
| Three black crows |
All three candles have wicks or very short wicks; normally, the three black
crows with no wick are considered the best ones.
What do the three black crows tell us?
Normally, the three black crows are big candles closed in red, making them
bearish candles.
As we know, bearishness always indicates the power of the seller over
buyers.
It makes the sentiment of the buyers weak over the sellers, as sellers are
very energetic at that moment.
Possible directions: trend reversal to bearish trend
The three black crows are the bearish reversal pattern, which is looked
up mostly by the sellers and buyers too. The sellers see it as an entry,
and the buyers see it as an exit from their positions.
4. Evening star
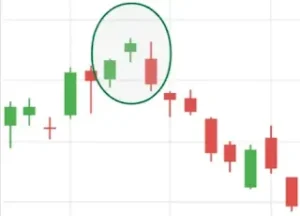
Evening star is one of the most searched patterns in the candlestick pattern.
Evening Star is a three-candlestick pattern that has three candles in it.
The first candle is a bullish candle, which denotes the continuation of the uptrend.
The second candle is a gap-up candle; it can be either green or red in colour, but it is for sure that it will close higher than yesterday’s close. and the last candle.
The third candle is a gap-down candle that is bearish in nature and is a big red candle.
 |
| Evening star |
The first and third candlesticks are the big candles compared to the second, which is small and gaped up.
What does the evening star candlestick pattern tell us?
As the evening comes after the day, similarly, in this way, the bearish trend comes after the bullish trend.
It is the cycle that will continue forever; we just have to identify it and trade according to it.
Basically, the everning star pattern is looked at at the top of the bullish trend because if it is found at the top, then the possibility of reversal becomes strong and certain.
Possible directions: reversal in the bearish trend
The first candle reflects the dominance of buyers over sellers.
In the second candle, there will be a gap-up opening, and in the third candle, the sellers are too heavy on the buyers.
3. Bearish Harami
Bearish harami, as the name suggests, is bearish in nature and has something to do with bearishness and
Whereas, about the word harami, as the name is given by the Japanese, in Japanese the term “Harami‘ means pregnant woman.
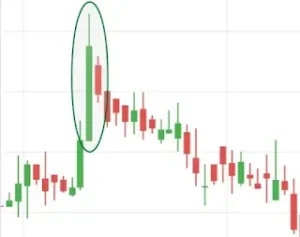
The bearish harami candlestick pattern is a two-candlestick pattern in which the first candle is a big green candle and the second is a small red candle.
But the thing to notice here is that the second candle will be closing inside the body of the first candle; its low and high will all be inside the first candle.
 |
| Bearish harami |
Bearish Harami candlestick pattern effectiveness increases when it is found at the top of the bullish trend and if it co-incides with the overbought levels of RSI and stochastic.
What does the bearish-harami candlestick pattern tell us?
The first candle of the bearish harami candlestick indicates the continuation of the bullish trend in the stock.
The second candle of the bearish harami candlestick indicates that the sellers are now active and that the price in the second candle is not exceeding the high of the first candle.
Possible directions: reversal in the bearish trend
As the bearish harami is a bearish candlestick pattern, when it is formed, the reversal is meant to happen, and the reversal is from the bullish trend to the bearish trend.
2. Bearish separating lines
Bearish separating lines are not the common patterns that are usually used in the candlestick chart.
But it is the strong pattern that indicates the strong start of the bearish trend, if found in the middle of the bearish trend.
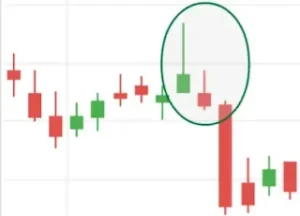
Bearish separating lines is a two-candlestick pattern in which the first candle is a long bullish candle and the second is a bearish candle that closes below the first candle.
But the thing that occurs between those two candles is that both of them have the same opening price.
If we look at the bearish separating pattern, then we will find that both candles are reflecting oppositely from each other.
 |
| Bearish separating lines |
In this pattern, the first candle goes upside and the second candle goes downside. And all this is happening in a downtrend or bearish trend.
What do the bearish separating lines tell us?
Bearish sepating lines are a bearish continuation pattern; if it happens in the middle of the downfall of the price, then there is a very good chance of a bearish trend in the near future.
Possible directions: continuation in the bearish trend
The first candle displays a strong buyer domination over the seller, whereas
The second candle makes a seller gain over the buyers, and the continuation of the bearish trend remains further.
1. Bearish engulfing
The bearish engulfing candlestick pattern is the most searched-for candlestick pattern by sellers.
Bearish engulfing is the most easy-to-get candlestick pattern, as it is normally available on candlestick charts.
It is very easily identified as it is made up of two candles.
The first candle in the bearish engulfing candlestick pattern is a bullish candle, and the second candle is a bearish candle.
When the second candle fully engulfs the body of the first candle, the bearish engulfing pattern is created.
The low, high, close, and open of the second candle are sometimes greater than those of the first candle.
 |
| Bearish engulfing |
The bearish-engulfing candlestick pattern is more profitable when it happens to occur at the top of the bullish trend.
What does the bearish-engulfing candlestick pattern tell us?
As we know, this candlestick pattern is basically for the sellers, as it indicates the future prediction of the bearish trend.
The second candle of the bearish engulfing candlestick pattern normally hides everything of the first candle and makes a very strong statement about the start of the rules of the downtrend.
If it coincides with the RSI and MACD, then the accuracy of the pattern increases.
Possible directions: reversal in the bearish trend
The first candle indicates the domination of the buyers over the sellers, and the second indicates the rule of the sellers and makes a new start to the bearish trend.
Aftermath
All five mentioned above are the topmost searched bearish candlestick pattern, mostly by the sellers and the buyer too, to exit their existing positions.
It should be considered better if it co-incides with indicators like RSI, MACD, etc. To know their overbought and oversold status.
Every trade that we are going to be in should be very cautiously traded.
Any patterns, tools, or indicators will work only if they are done with money management.
Bearish candlestick patterns are the most useful things to see to make ourselves confident in our trade and to get the stoploss and target right.
FAQs
Below are some of the frequently asked questions related to bearish candlestick patterns.
- [question 1]
- What does the bearish trend mean?
- A bearish trend means a downtrend in which sellers are heavy on buyers.
- [question 2]
- How accurate is the bearish candlestick pattern?
- It is so accurate that many traders only see the patterns to judge their trades; as no pattern or nothing in the market is 100% accurate, so do the patterns.
