Bands indicator? We know that most of us might be wondering what bands
are.
Well, that’s what the important things are to get from the market.
Band indicators are indicators that are made to inform traders
about the market volatility of the present market or stock situation at the
present moment.
Because the volatility of the present is the utmost thing that traders are
very curious to know, trading in the volatility market is something that
should be done with lots of caution and patience.
If there is volatility and if we get to know it, then somewhere trading
becomes less harmful because it would be done with more accuracy.
So, basically, what the band indicators do is that they indicate somewhere the
possible volatility situation that exists at the present moment.
Below are the 5 best band indicators; actually, almost every band
indicator is discussed below.
5. ATR band
ATR stands for average true range. The ATR band is basically a volatility-identifying indicator; it is not
made to show you trends in the stock or anything like that, by which you can
identify the direction of the stock.
The calculation of the ATR band is very simple, and it basically goes
like this:.
If you have set your default period to 20, then.
ATR = {(Previous ATR x 19) + current True range) / 20
For the upper band, = {SMA + (current true range X multiplier)}.
For the lower band, = {SMA – (current true range X multiplier)}.
Note: SMA is a simple moving average, and the multiplier is normally set to 2.
How do I trade with the ATR band?
The most important thing is: how should we use the ATR band in our trading?
The ATR band is not an indicator that gives the buy-and-sell signal itself; it
is a volatility-measured indicator that represents the idea of the volatility
at present in the stock.
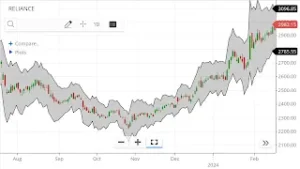 |
| ATR BAND |
There are mostly two ways in which we can trade using the ATR Band.
- support and resistance: as there are two bands in the ATR band, one
is the upper band and the other is the lower band. The upper band represents
the resistance, and the lower band represents the support. - Breakout and Breakdown: As the band is narrower, the possibility of
breakout and breakdown is low, and as the length of the band increases or
widens, the possibility of breakout and breakdown increases.
Stoploss
is set on the basis of the band size or breadth.
4. Fractal Chaos Band
It is not a very well-known indicator in the market and is not used by many
traders.
But the effect of the indicator on the chart and on the price of the stock is
shocking and useful to the traders to identify a possible way of trading.
The fractal chaos band indicator is displayed in the band and
has an upper and lower band. The lower band displayed the low price of certain
given default periods of the indicator.
The upper period displays the high of a certain default period of the
indicator.
With the help of the upper and lower bands, trades are initiated, and
decisions are made about when to exit the trades.
How do I trade using the fractal chaos band indicator?
Well, the main thing or intention behind using any indicator is to get the
idea of buying and selling the stock, just as the fractal chaos band is used.
TRENDS are easily predictable from the fractal chaos band, as when the band is
on the upside trend, it has some slope or incline on the upside, and when it
is on the downside trend, it displays incline on the downside.
But when the stock is not going either way, the indicator does flatten up.
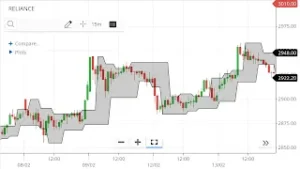 |
| Fractal chaos band |
This fractal chaos band is used mostly for the purpose of doing two things,
and they are:
- support and resistance trading: when the price touches the lower band line, support is to be assumed, and
when the price touches the upper band line, resistance is to be assumed. - breakout and breakdown trading: simply when the upper band is broken by a bullish candle, breakout
happens, and breakdown happens when the lower band is broken by a bearish
candle.
whereas the stoploss is always made below or above the opposite
band price level.
For example, if we have bought a stock, the stoploss should be below the lower
band price level, and if we have shorted, the stoploss should be above the
upper band price level.
3. Prime number band
Prime number bands, as the name suggests, have something to do with the prime
numbers.
The prime number band indicator is not a trend-identifying
indicator; it is solely based on the calculation of the prime numbers.
The plotting of the prime number band is done with the help of prime numbers.
To plot the upper band, the nearest prime number is taken, and to plot the
lower band, the same thing is done.
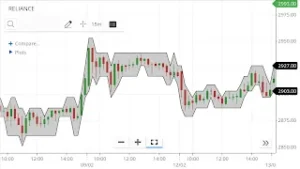 |
| prime number band |
It really blows anybody’s mind how the number calculations react so much in
the market or in any stock.
How do I trade using the prime number band indicator?
This band is really gaining popularity, especially with the day trading
strategy.
There are normally three types of trading associated with these prime number
band indicators. And they are:
support and resistance: if we look at the chart, then we will find that the lower and upper bands
somewhere make a horizontal type of line that reacts as a strong support and
resistance level.
If touching the lower band support level is to be meant, and if touching the
upper band resistance level is to be taken,.
Breakout and breakout: As we have mentioned, the band somewhere draws or makes a line at the top
and bottom of the band, and if that line gets broken up or broken down, then
breakout and breakdown happen.
Pointed edge trading: this is a special kind of strategy used in this band to trade. As we have
seen many times in the band that the band is making a pointed edge or mountain
edge type of structure in the band, then the reversal or change in the price
is to be realized.
If the pointed edge is on the up side, then it is likely to be seen that the
price will go down, and if it is happening on the down side, then the price
will be seen on the up side in the near future.
Stoploss as usual: if it is a band and we are trading using it, then going long side below the
lower band is the stoploss, and if going short, then above the upper band, the
stoploss should be made.
2. High-low band
A high low band is basically a triangular type of moving average
in which three different types of moving average whose periods are not the
same are taken, and on the basis of that, this band, which is known as a high
low, is made.
The three lines in this indicator define the highest high, which is the upside
band; the lowest low, which is the downside band at the bottom; and the middle
band, which defines the average of both.
As the three lines of the band are defined above, trading with this band
becomes easier and more comfortable than with the earlier band discussed
above.
How do I trade using the high-low band?
Normally, trading with this band happens when the band is making the support
and resistance levels, when a breakout or breakdown happens, or when the price
of the stock is going or trading above the middle line of the band.
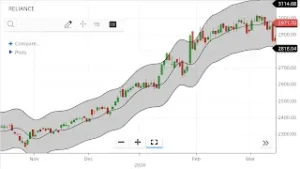 |
| high low band |
Let us discuss, one by one, how trading happens.
1. Support and resistance: support is taken when the price of the stock is taking the support on the
downside band line at the bottom from the upside, and resistance happens when
the upside band line is resisting the price of the stock from the upside.
2. breakout and breakdown: breakout happens when the price of the stock is breaking the upside band,
and when the price of the stock is breaking the downside band line at the
bottom, breakdown happens.
3. Middle line band trading: the trading in the middle line happens when the price is above it, then
buying happens, and when it is below it, then selling happens.
As it is not only the way to look out for trade, other technicals are seen to
go inside for trading, like executing our trade with the high low band using
it with the MACD, RSI, etc.
1. STARC BAND
The stoller average range channel (STARC BAND) is one of the most
popular bands to determine the volatility of the stock, and its trend can be
easily determined by using this band.
If we talk about its making, then we will find the three lines, which are the
upper band line, the midpoint, or simple average line, and the lower band
line.
Formulas are:
As we select it, we are already given the defalut figures, which should not be
changed for better use of this indicator.
For the upper band: SMA + (multiplier x ATR)
For the lower band: SMA + (multiplier x ATR)
For some of the platforms, the moving average ranges from 5 to 10.
whereas the multiplier defaults from 1 to 1.5.
How do I trade using the STARC Band?
Well, there are many ways in which you can trade using the starc band, and
some of them are:
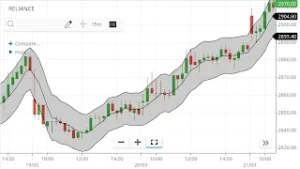 |
| STARC BAND |
Using the midpoint or the SMA line: there are many traders who use the
midline as a buying or selling point and initiate their trades until the
target of the lower or upper band.
Breakout or breakdown: if the breakout happens to the upper band, then
buying is possible to be seen as a good trade, and if the breakout happens to
the lower band, then selling is seen as a good trade.
Support and resistance: the lower band is seen as a good support level,
whereas the upper band is seen as a good resistance level.
Stoploss is the level where the stock is very aware of it and
rarely touches it.
That level should be the stop-loss for any trade using the STARC BAND.
For example, if we are trading using the midline strategy as discussed above,
then the stoploss should be below the midpoint line.
Final thoughts on band indicators
Bands are the real way to analyze and determine the true volatility of a
stock.
But it should also be kept in mind that stoploss is of utmost importance while
using the band indicator.
Band indicators will be helpful if done with discipline and making ourselves
out when stoploss is triggered.
FAQs
Frequently Asked Questions regarding the band indicators.
- Which band indicator is the best?
- Everyone is the best, but the STARC BAND indicator still has a
special tendency to smooth trades for traders.
- Everyone is the best, but the STARC BAND indicator still has a
- Does the band indicator include the moving average?
- Yes, many of them include it like the STARC Band does.
- Which band indicator is the best?

