Vedanta Ltd.’s share falls under the metals and mining sector and is included in the Metals (non-ferrous) industry.
The surge of 6.12% on Friday, December 6th, 2024, was due to the release of encumbrances on the equity shares with the $1.2 billion bond issued by Vedanta Resources Finance II PLC.

As of September 2024, the public holding for Vedanta Ltd. (VEDL) share remains at 15.53%; the promoter has the most significant share, 56.38%.
Please note that DII (Domestic Institutional Investors) has the second largest shareholding, 16.47%, after the Promoter’s shareholding, 56.38%.
Which makes the share more reliable and trustworthy for future investments.
Some of the crucial standalone figures as of the year 2024 are:
- Earning per share (EPS) remains at 17.80; in 2023, it was 73.54.
- ROE is 10.10, while in 2023, it was 40.34.
- Total income is 76308 cr. With EBIT remaining at 19414 cr.
- Total expenditure is 56894 cr, and the net profit remains at 6623cr.
- Reserves and surplus are 65164cr.
- Net cash flow is -3659.
The price for the Vedanta share on 6th December 2024 is as follows:
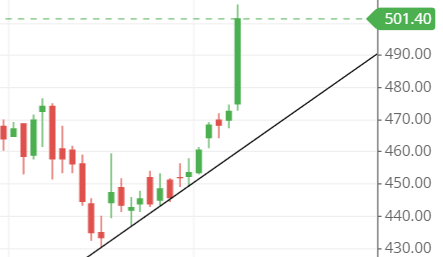
Open – 475, High – 505.55, Low – 472.80 and close – 501.40.
Technical analysis
After getting the information related to Vedanta Ltd.’s financials, let’s find the technical figures pertaining to the company from the stock chart, especially the candlestick chart of Vedanta stock.
We will try to learn the technical figures based on Moving averages, support and resistance, chart patterns, and candlestick patterns.
What is the trend according to the trendline?
One of the most important things to understand before buying, selling, or making any decision relating to a stock is its present trend.

The trendline in the chart goes from down to up, making it a bullish trend because the flow of momentum in the stock is from below to above, giving a rise in the stock price.
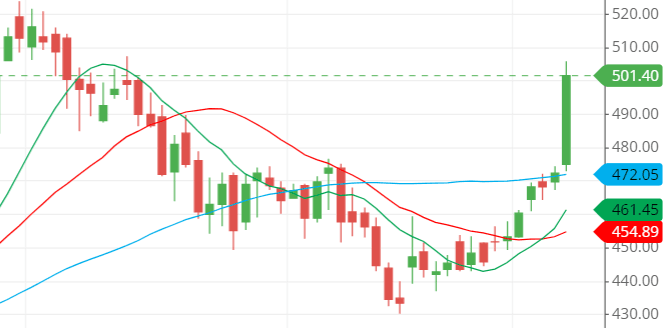
Vedanta shares SMA (simple moving average) lines.
Let us understand that the color line shown in the chart has different timing lines, and they are:
Blue – 50 days SMA
Green – 10 days SMA
Red – 21 days SMA

The chart shows that the stock’s price is above all SMA lines, indicating a strong bullishness.
However, the lines are not in the current order because the 10-day SMA is crossing the 21-day great SMA. Above that, the 50-day SMA creates a problem; instead, it should have been at the bottom of the 10-day and 21-day SMAs.
After seeing the moving average, it doesn’t that much entice me to go for it for a short-term perspective.
Support & resistance of Vedanta share
On Friday, December 6th, 2024, the stock broke the resistance level at around 488 and touched the next resistance level, around 512.
The next three possible support and resistance levels are:
Support – 488, 477 and 455.
Resistance – 501, 514 and 522.
The support and resistance levels indicate a strong resistance level at the present moment in the stock, which would disturb upside movement because of the closeness of the resistance levels at the top side.
Chart & candlestick patterns of Vedanta share
These create certain patterns that occurred in the past and keep repeating whenever the same kind of patterns are made in the chart.
Candlestick pattern—The combined candlestick pattern made on December 5th and 6th, 2024, was a Bullish Engulfing pattern, which indicates buying in the stock now.
Chart pattern – the chart pattern seems to be a pattern which is rising as the trendline moves upside.
Last thought
Expecting a move from what happened on Friday will be overextended because the stock has already moved above 6%. However, if it gaped up on Monday and closed above 526, then 600 could be expected.


